

Table of Contents
- Introduction
- What is a Kubernetes metrics server?
- What is a Kubernetes metrics server used for?
- Kubernetes metrics server requirements
- Metrics to watch
- How to deploy a metrics server?
- Querying the Metrics API with kubectl
- Using Kubernetes dashboard for watching metrics
- Troubleshooting common errors
- Using Hosted Graphite by MetricFire to monitor Kubernetes
- FAQs
- Conclusion
Great systems are not just built. They are monitored.
MetricFire runs Graphite and Grafana as a fully managed service for growing engineering teams, taking care of storage, scaling, and version updates so your team doesn't have to. Plans start at $19/month, billed per metric namespace rather than per host, and include engineer-staffed support. Integrations work natively with Heroku, AWS, Azure, and GCP, and data is stored with 3× redundancy in SOC2- and ISO:27001-certified data centres.
If you landed here to check whether Metrics Server is installed and working, start with the quick commands below. Then dive into setup, querying the Metrics API, and alternatives for cluster-wide monitoring.
Introduction
In this article, we will examine the Kubernetes Metrics Server and its uses. We will also learn how to set one up and use it to monitor Kubernetes metrics. Finally, we will explore using Hosted Graphite by MetricFire to monitor Kubernetes metrics.
To easily get started with monitoring Kubernetes clusters, check out our tutorial on using the Telegraf agent as a Daemonset to forward node/pod metrics to a data source and use that data to create custom dashboards and alerts. Then, to learn more about monitoring Kubernetes metrics using hosted Graphite by MetricFire, book a demo with the MetricFire team or sign up for the free trial today.
What is a Kubernetes metrics server?
A Kubernetes Metrics server is a cluster add-on that allows you to collect resource metrics for autoscaling pipelines from Kubernetes. After receiving metrics, it delivers these aggregated metrics to the Kubernetes API server via the Metric API. The metrics server is used solely for autoscaling.
The main advantages of Kubernetes metrics server:
- Efficient use of resources.
- Scalable support for up to 5000 cluster nodes.
- Single deployment for most clusters.
- Systematic collection of metrics, by default, every 15 seconds.
What is a Kubernetes metrics server used for?
Let’s look at the cases where you can use a metrics server.
- Horizontal autoscale based on CPU or memory. It is implemented as a control circuit with a period controlled by the controller manager flag (default value: 15 seconds). The controller manager requests resource usage for the specified metrics during each period. The controller manager obtains metrics from the Resource Metrics API or the Custom Metrics API. Automatic horizontal unit scaling does not apply to objects that cannot be scaled.
- Automatically configure or suggest resources needed by containers. Vertical Pod Autoscaling (VPA) automatically scales queries based on usage, ensuring nodes have the appropriate amount of resources for each pod. It can also maintain the ratios between limits and requests specified in the initial container configuration. Depending on how they are used over time, it can either downscale modules that are over-requesting resources or upscale modules that are over-requesting resources.
You should use tools other than the metrics server in the following cases:
- Monitoring cluster metrics that are not Kubernetes-specific.
- To get an accurate source of resource utilization metrics.
- For horizontal autoscaling based on resources other than CPU or memory.
Kubernetes metrics server requirements
Before using Metrics Server, you need to check that your network and cluster have the following settings:
- Server metrics address: If hostNetwork is enabled, the host's IP address is used; otherwise, the container's IP address is used.
- The aggregation level must be enabled on the Kube API server.
- The cluster nodes must have Webhook authentication and authorization enabled.
- If Kubelet certificate validation is enabled on the metrics server, it must be signed by the cluster CA.
- The container runtime must either implement RPC container metrics or support cAdvisor.
Metrics to watch
Let’s look at the main groups of Kubernetes metrics that can be monitored using the metric server.
Cluster state metrics
These metrics show the health and availability of Kubernetes items. They are used to keep track of whether the modules are working as expected. These metrics provide high-level information about the cluster's health and can help identify problems with nodes and pods. Cluster state metrics include node status, desired pods, current pods, available pods, and unavailable pods.
Resource metrics
These metrics help you determine whether the cluster can handle its workloads and new workloads. It is possible to track resource use at different levels within the cluster. This group includes the following metrics: memory requests, memory limits, allocatable memory, memory utilization, CPU requests, CPU limits, allocatable CPU, CPU utilization, and disk utilization.
Control plane metrics
This group includes metrics for monitoring the operation of the primary services and resources used to manage the cluster, such as API servers, controller managers, schedulers, and data stores.
How to deploy a metrics server?
Some clusters include default server metrics deployment. To check whether the metrics server is running on your cluster, run the following command:
kubectl get pods --all-namespaces | grep metrics-server
If the metrics server is running, you will see information about the running nodes in the response. Otherwise, run the following command to install the latest version of server metrics.
kubectl apply -f https://github.com/kubernetes-sigs/metrics-server/releases/latest/download/components.yaml
Querying the Metrics API with kubectl
After setting server metrics, you can get metrics for any node or pod using the kubectl get tool. Use the following commands to get metrics for all nodes and pods.
# Get the metrics for all nodes
kubectl get --raw /apis/metrics.k8s.io/v1beta1/nodes


# Get the metrics for all pods
kubectl get --raw /apis/metrics.k8s.io/v1beta1/pods
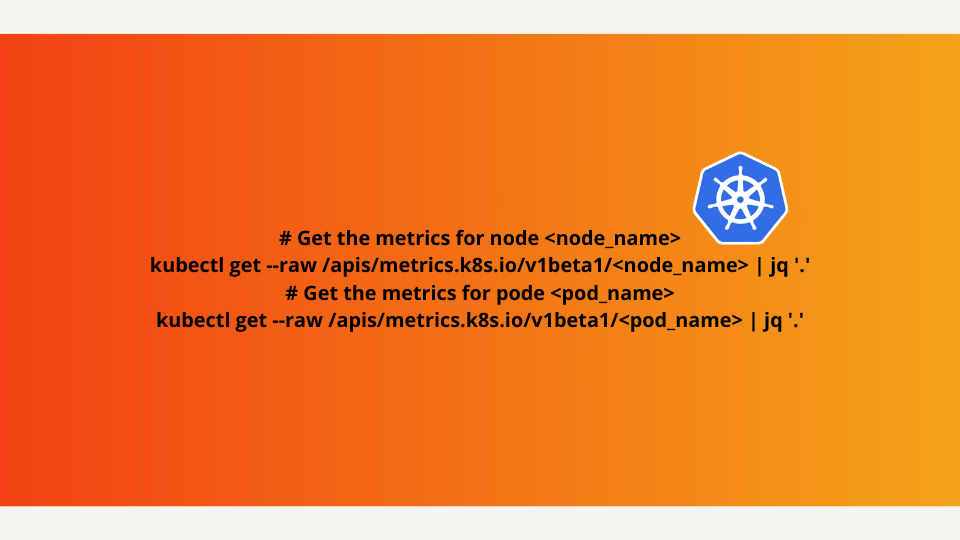
You can also get metrics for a single selected node or pod. To do this, you need to specify its name, as shown in the following commands.
# Get the metrics for node <node_name>
kubectl get --raw /apis/metrics.k8s.io/v1beta1/<node_name> |  jq '.'
# Get the metrics for pode <pod_name>
kubectl get --raw /apis/metrics.k8s.io/v1beta1/<pod_name> | jq '.'
To get a list of all nodes or pods in a given namespace, run the kubectl get nodes or kubectl get pods command, respectively.
The Metric API returns the result in JSON format. To display JSON in a human-readable form in the terminal, use the jq utility to output.
Use the kubectl top command to view the current CPU and memory usage for all nodes or for individual nodes or pods. The following command returns resource usage by all pods.
kubectl top pod
You can read more about using the kubectl tool and its commands here.
Using Kubernetes dashboard for watching metrics
Kubernetes dashboard is a graphical tool for monitoring and managing a cluster. It provides the same functionality as kubectl. The Kubernetes dashboard has a panel that provides a convenient metrics breakdown for each node and pod. In addition, the dashboard has charts that allow you to track how the metrics have changed over a certain period.
To install the latest version of the Kubernetes dashboard, run the following command:
kubectl apply -f https://raw.githubusercontent.com/kubernetes/dashboard/v1.10.1/src/deploy/recommended/kubernetes-dashboard.yaml
To access the dashboard interface through the browser, run the following command:
kubectl proxy
Next, you need to generate and enter an authentication token using the command:
kubectl --namespace kubernetes-dashboard describe secret $(kubectl -n kubernetes-dashboard get secret | grep admin-user | awk '{print $1}')
After completing the authentication, you can access the dashboard graphical interface, which you can use to monitor metrics and edit Kubernetes objects.
Troubleshooting common errors
-
metrics.k8s.io is unavailable→ Verify Aggregation Layer is enabled on the API server and that the APIServices condition isAvailable=True. -
no metrics known for nodes/pods→ Wait 15–30s for first scrape; ensure Kubelet authZ/webhook and CA trust are configured as per your “requirements” list. -
TLS or certificate errors to Kubelet → Ensure Kubelet certs are signed by cluster CA if validation is enabled.
Using Hosted Graphite by MetricFire to monitor Kubernetes
A production-level Kubernetes infrastructure can require a few hundred nodes and upwards of a few Mbps of network traffic. Therefore, you must scale out both Graphite and Grafana to handle the increasing load.
That’s where Hosted Graphite and Hosted Grafana come into the picture. These allow you to scale for long-term storage and provide redundant data storage without going through the arduous process of setting up Graphite and Grafana. You don’t have to worry about installing, configuring, and maintaining your monitoring system, but view the metrics on a web page.
Hosted Graphite and Hosted Grafana through MetricFire allow for the continuous active deployment of new features, as MetricFire’s products all have their foundations in the ever-growing open-source projects. Configuring a Snap Daemon to send Kubernetes metrics to your MetricFire account is simple. It just requires configuring your account's API key to be used as the prefix for each metric and the URL Endpoint to be used as the server destination. Check out our article Monitoring Kubernetes with Hosted Graphite to learn how to set up monitoring your Kubernetes infrastructure quickly and easily using our Hosted service.
Other benefits of using MetricFire:
- No vendor lock-ins: MetricFire provides continuous, uninterrupted access to your data at any time.
- Easy Budgeting: You can choose the pricing plan that suits your needs.
- Transparency: MetricFire works transparently on all aspects of its SaaS system monitoring operations. Its internal system metrics are on its public status page.
- Robust Support: If you have any difficulties working with MetricFire, MetricFire engineers will always provide a comprehensive answer to any question by phone or video conference.
If you want to know about monitoring Kubernetes metrics with MetricFire, book a demo with our engineers or sign up for a MetricFire free trial today.
FAQs
Add as an FAQ accordion near the end.
Q1. How do I check if Metrics Server is installed in Kubernetes?
Run kubectl get pods -n kube-system | grep metrics-server and kubectl -n kube-system get deploy metrics-server. If missing, apply the latest components manifest.
Q2. How can I verify that the Metrics API is responding?
Use kubectl get --raw /apis/metrics.k8s.io/v1beta1/nodes or /pods and inspect the JSON output. A 200 response with items indicates success.
Q3. Why does kubectl top return “no metrics known for nodes/pods”?
Initial scrapes may take ~15s. Ensure the Aggregation Layer and Kubelet auth settings meet the requirements listed in your article.
Q4. What’s the quickest way to install or update Metrics Server?
Apply the upstream release manifest:kubectl apply -f https://github.com/kubernetes-sigs/metrics-server/releases/latest/download/components.yaml.
Q5. Do I still need Metrics Server if I use a full monitoring stack?
Yes for HPA/VPA CPU/memory autoscaling; use another stack for long-term storage, custom metrics, and dashboards (e.g., MetricFire’s Hosted Graphite/Grafana).
Conclusion
Kubernetes metrics server is a powerful tool for monitoring Kubernetes autoscaling metrics based on CPU or memory. However, for it to work, you need to invest enough time configuring several tools and settings. A better alternative would be to use Hosted Graphite by MetricFire, making monitoring all your Kubernetes metrics easy. To easily get started with monitoring Kubernetes clusters, check out our tutorial on using the Telegraf agent as a Daemonset to forward node/pod metrics to a data source and use that data to create custom dashboards and alerts.
Book a demo with the MetricFire team or sign up for the MetricFire free trial to find out more options that MetricFire has to offer.


