
Table of Contents
Great systems are not just built. They are monitored.
MetricFire runs Graphite and Grafana as a fully managed service for growing engineering teams, taking care of storage, scaling, and version updates so your team doesn't have to. Plans start at $19/month, billed per metric namespace rather than per host, and include engineer-staffed support. Integrations work natively with Heroku, AWS, Azure, and GCP, and data is stored with 3× redundancy in SOC2- and ISO:27001-certified data centres.
Introduction
Application Performance Monitoring(APM) is the process of setting SLAs for the various performance indicators of your applications along with monitoring and measuring those SLAs to provide the end-user experience that your company requires. APM could refer to a variety of things; for an organization that provides Business to Consumer (B2C) solutions, it would involve monitoring the performance of their web applications to ensure that the solution offers the predicted end-user experience desired by the business.
For a retail company that has recently implemented an ERP solution, APM would entail monitoring all ERP applications end to end to ensure that the end-user experience is delivered as expected to all internal stakeholders and system users across the organization. The Application Performance Monitoring principles described here are based on a mix of what the industry currently provides in terms of solutions and our expertise in managing performance for small and big clients worldwide.
Before we start with the fundamentals and examine the various types of monitoring offered, it's important to know about your choices of best APM solutions in the market. MetricFire is the industry leader in monitoring solutions. With minimum configuration, our system can provide you access to a wide range of information about your settings. If you'd like to learn more about it, please contact us to schedule a demo or sign up for a free trial.
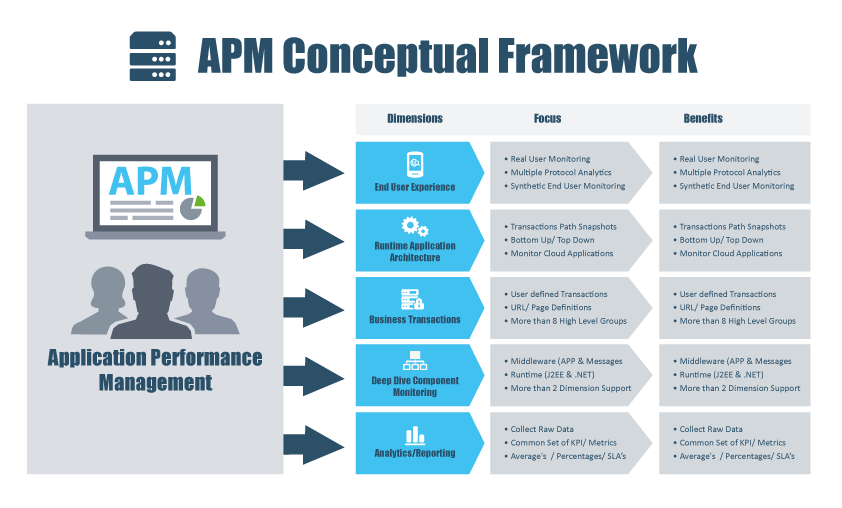
Components of Application Performance Monitoring (APM)
Real User Transaction Monitoring
Real User Transaction Monitoring includes a live breakdown of network traffic coming into your application across the network to monitor various user processes or business activities. Real User Monitoring tools are capable of analyzing business transactions going over the network in real-time with the goal of proactively spotting any violation of service level agreement (SLA).
This is often accomplished by connecting to the SPAN ports of your datacenter's network switches and routing a COPY of all that data to the Real User Monitoring appliance. The monitoring engine inside the appliance then does real-time analysis and provides a dashboard representation of end-user transactional performance. RUM tools have advanced significantly in intelligence over the years, and there are several solutions available.
They are much more costly, considering the advanced nature of the service, and are often delivered through pizza box solutions. Real User Monitoring technologies often give a real-time view of application performance across all customer processes or business activities while also measuring the end-user experience (response times, availability, etc.).
End-User Transaction Monitoring
End User Transaction Monitoring involves deploying robots to insert transactions from various places around the network. Several End-User Transaction Monitoring systems enable you to record scripts that can then be replayed using injectors at the network edge or at various points of presence throughout the internet. There are a few specialty businesses in this market that sell services (SaaS). In this situation, the suppliers invest in the resources, software, and infrastructure needed to monitor your applications from various locations around the internet.
Most End User Monitoring products enable you to define injection frequency as well as the locations from which transactions should be injected into your data centre. End-user monitoring solutions have less insight (as compared to RUM tools) into end-user application performance since they are limited to a specific group of users in a production environment and don't have a perspective of what's going on in other portions of the system unless you go to the effort of recording and monitoring all essential customer processes, which in some situations may be a massive number of transactions.
Customers have also reported needing to re-record scripts often when their processes change due to new program releases. End-User Monitoring tools, on the other hand, are limited in terms of the view they can provide of true end-user performance and have the significant drawback of demanding dummy users to be created in production environments, putting additional monitoring workload on the production applications, which in many cases does not work.
Application Performance Monitoring
Application Performance Monitoring tools are the monitoring solutions for applications that are focused on gathering and measuring performance indicators. These tools are often simple to set up and, depending on their design, maybe intrusive or non-intrusive. These tools are usually meant to reside outside of the application container (local or remote) and establish connections to the application container (web, application, database, integration, etc.) at pre-determined time intervals to acquire various performance indicators (queue length, heap size, concurrent users, thread pool size, etc.).
Since they are focused on obtaining essential application container performance information, Application Performance Monitoring technologies are often less expensive, faster to set up, and need less maintenance. These tools, however, bring little value by themselves and should be used in conjunction with system monitoring tools (CPU utilization, memory utilization, etc.) and end-user experience management tools to give a holistic view of performance across your apps.
Application Diagnostics – Container-Level Diagnostics
Application Diagnostics tools diagnose performance problems in production and test settings involving application containers (J2EE Virtual Machines and.Net CLR). Container-level diagnostics tools are often simple to configure and must be loaded into the application container at run time.
Once loaded into the application container, these diagnostics tools display all execution paths, heap usage, code blocks, poorly performing transactions, and the most frequently executed transactions, giving a comprehensive view of the application's performance across the application container. However, a significant limitation of most container-level diagnostics solutions has been their inability to connect application performance problems inside the container with particular customer actions triggered by end-user customer requests.
Application Diagnostics - End to End Transaction Visibility
These tools were developed to address the limitations of the previous generation of Container Level Diagnostics tools, which were designed to identify performance issues within application containers but could not correlate identified performance bottlenecks with customer workflows or transactional workflow. The next generation of container-based technologies in this domain, with agents placed on your multiple application tiers.
They enable you to trace a client request from submission to delivery. Since these tools span containers, they provide visibility into application performance inside a container and transactional performance across many levels. These technologies, in our opinion, are reasonably simple to implement on web apps (HTTP, HTTPS) but need substantial customization when used with non-HTTP/HTTPS protocols.
System Performance Monitoring
System (CPU, Memory, and Disk) performance monitoring is a mature area, with a large number of enterprise-wide solutions providing the out-of-the-box capability for most regularly used platforms (Linux, Windows, Aix, HP-UX, etc.). Systems Performance Monitoring tools often run as a lightweight process inside the Operating System. They have a good perspective of the system's resource use and the purpose of collecting all-important performance indicators.
Your tool selection in this area should be driven by the support provided by your infrastructure platform, particularly the capacity of your system's tools to interface with your overall performance dashboards, providing you with a unified overview of platform performance.
Important Factors When Developing Your APM Solution
Developing solutions for Application Performance Monitoring entails taking into account a vast number of factors. While the list below is not complete, it does give a starting point for considering the appropriate tools for your purpose.
- How would I define end-user experience?
- Are we receptive to Open Source alternatives?
- What application stacks are involved?
- How well are these tools supporting these application stacks?
- What different hardware stacks are involved?
- Will the various monitoring solutions for my different needs integrate?
- Can I get a single consolidated view of performance across all my monitoring solutions?
- What level of integration is offered by the toolsets being selected?
- Does your provider have a track record of providing tools and ensuring they remain compatible with new platform releases? (Hardware, OS, etc.)
- Do the tools enable me to collect data in a format suitable for analysis, modeling, and forecasting?
- How straightforward is it to extract data for analysis, modeling, and forecasting?
- What is the licensing paradigm for the tools you're considering?
- How flexible is your vendor conducting a proof of concept before you invest in the solution?
- What level of capability and commitment can your vendor provide to support the tools' implementation across the enterprise?
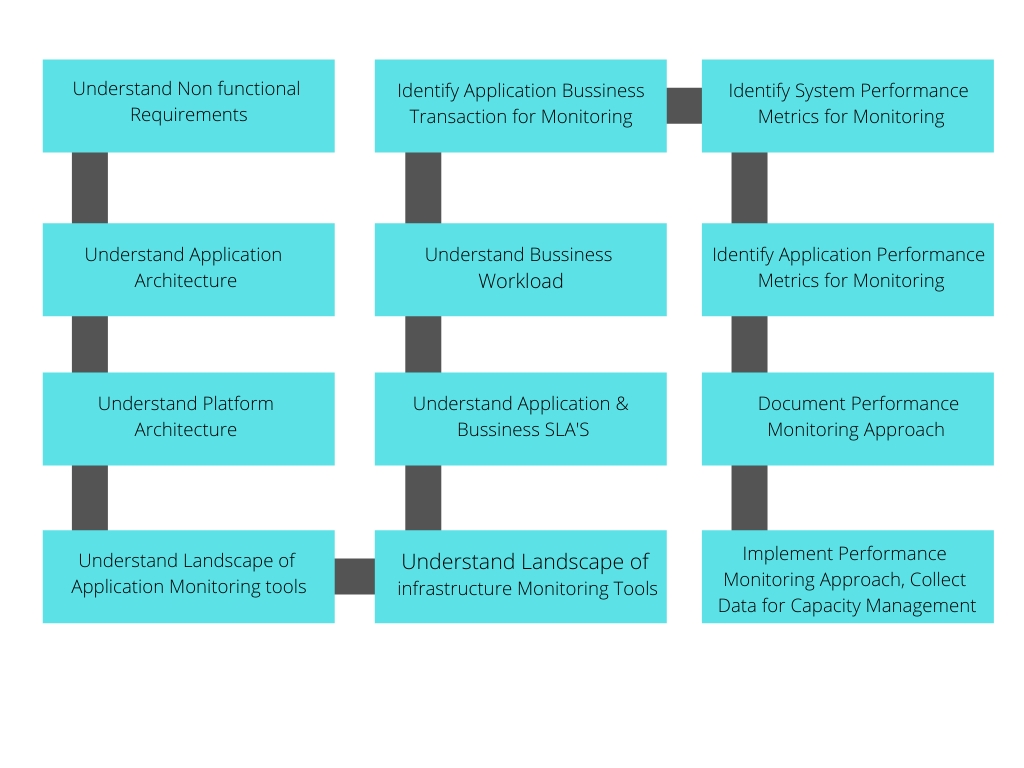
Activities Involved in Monitoring Application Performance
Developing an Application Performance Monitoring solution is a significant undertaking. You are responsible for collaborating with business and IT stakeholders to define the appropriate set of monitoring criteria that verify your current operational service level agreements (SLAs). The following flowchart is a checklist of the steps required in creating your Application Performance Monitoring solution.
Application Performance Monitoring Tools
Whether open-source or commercial, your choice of tools is determined by the capability you need, the task at hand, the performance/features you expect, and the amount of time you are willing to pay to set up/manage the deployment.
The following is a brief overview of three of the most widely used Application Performance Monitoring (APM) tools -
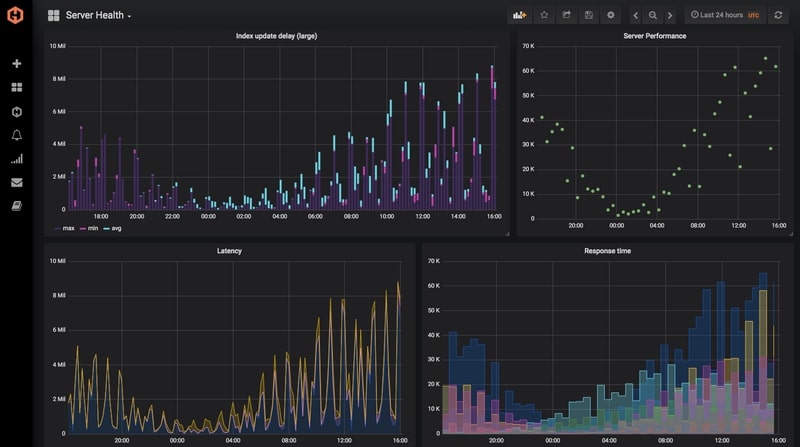
Hosted Graphite by MetricFire
MetricFire is a cloud-based server and application monitoring solution that is scalable from hundreds to millions of unique metrics at the enterprise level. You can choose between Hosted Prometheus or Graphite and observe your metrics in real-time on attractive Grafana dashboards with built-in alerts that interact with your current technologies like Amazon Web Services, Ops Genie, Heroku, Slack, and HipChat.
Hosted Graphite enables you to monitor your software and servers' performance. They'll provide you with high-resolution dashboards that show you exactly what's going on with your technology. You can receive warnings when your data is underperforming, and you can collaborate with your team on graphs and dashboards. It is a centralized view of the performance of your application.
It's best For Technology teams, DevOps, and operations engineers that want visibility into their servers and apps.
Traceview
Previously called Tracelytics, it was bought by AppNeta and is now a part of SolarWinds. It is a web application performance monitoring tool. It gives a comprehensive view of the application, improves the end-user experience, and is a highly cost-effective performance monitoring tool.
Significant Characteristics:
- Traceview is compatible with Java,.NET, PHP, Ruby, and Python, among others.
- It monitors online applications and software as a service (SaaS) applications.
- Traceview enables extensive monitoring of code-level performance.
- It resolves the issue by the deployment of a real-time user monitoring system.
- It offers online, email, and phone help.
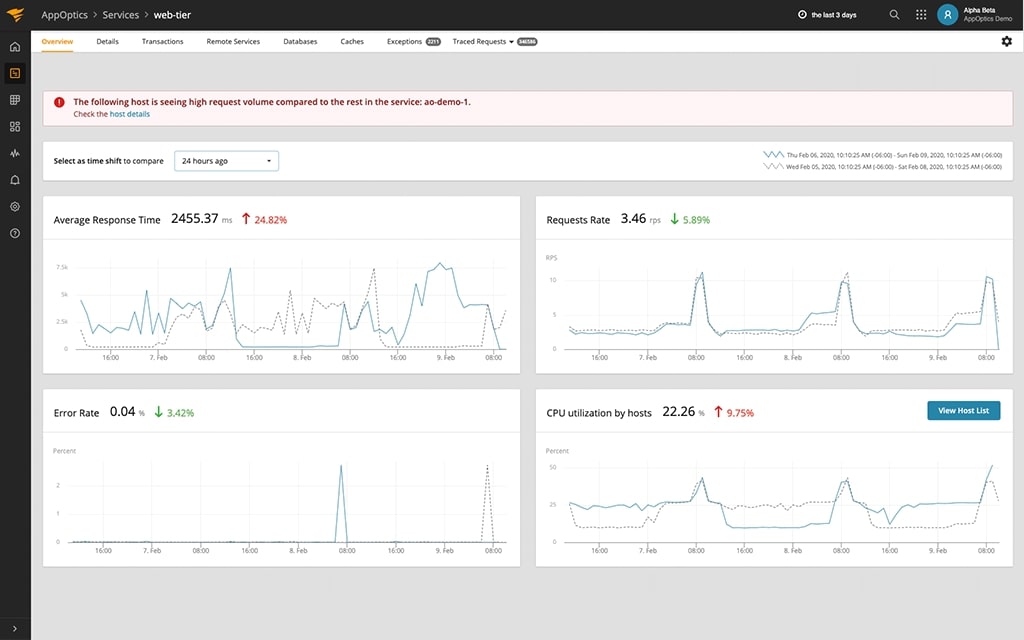
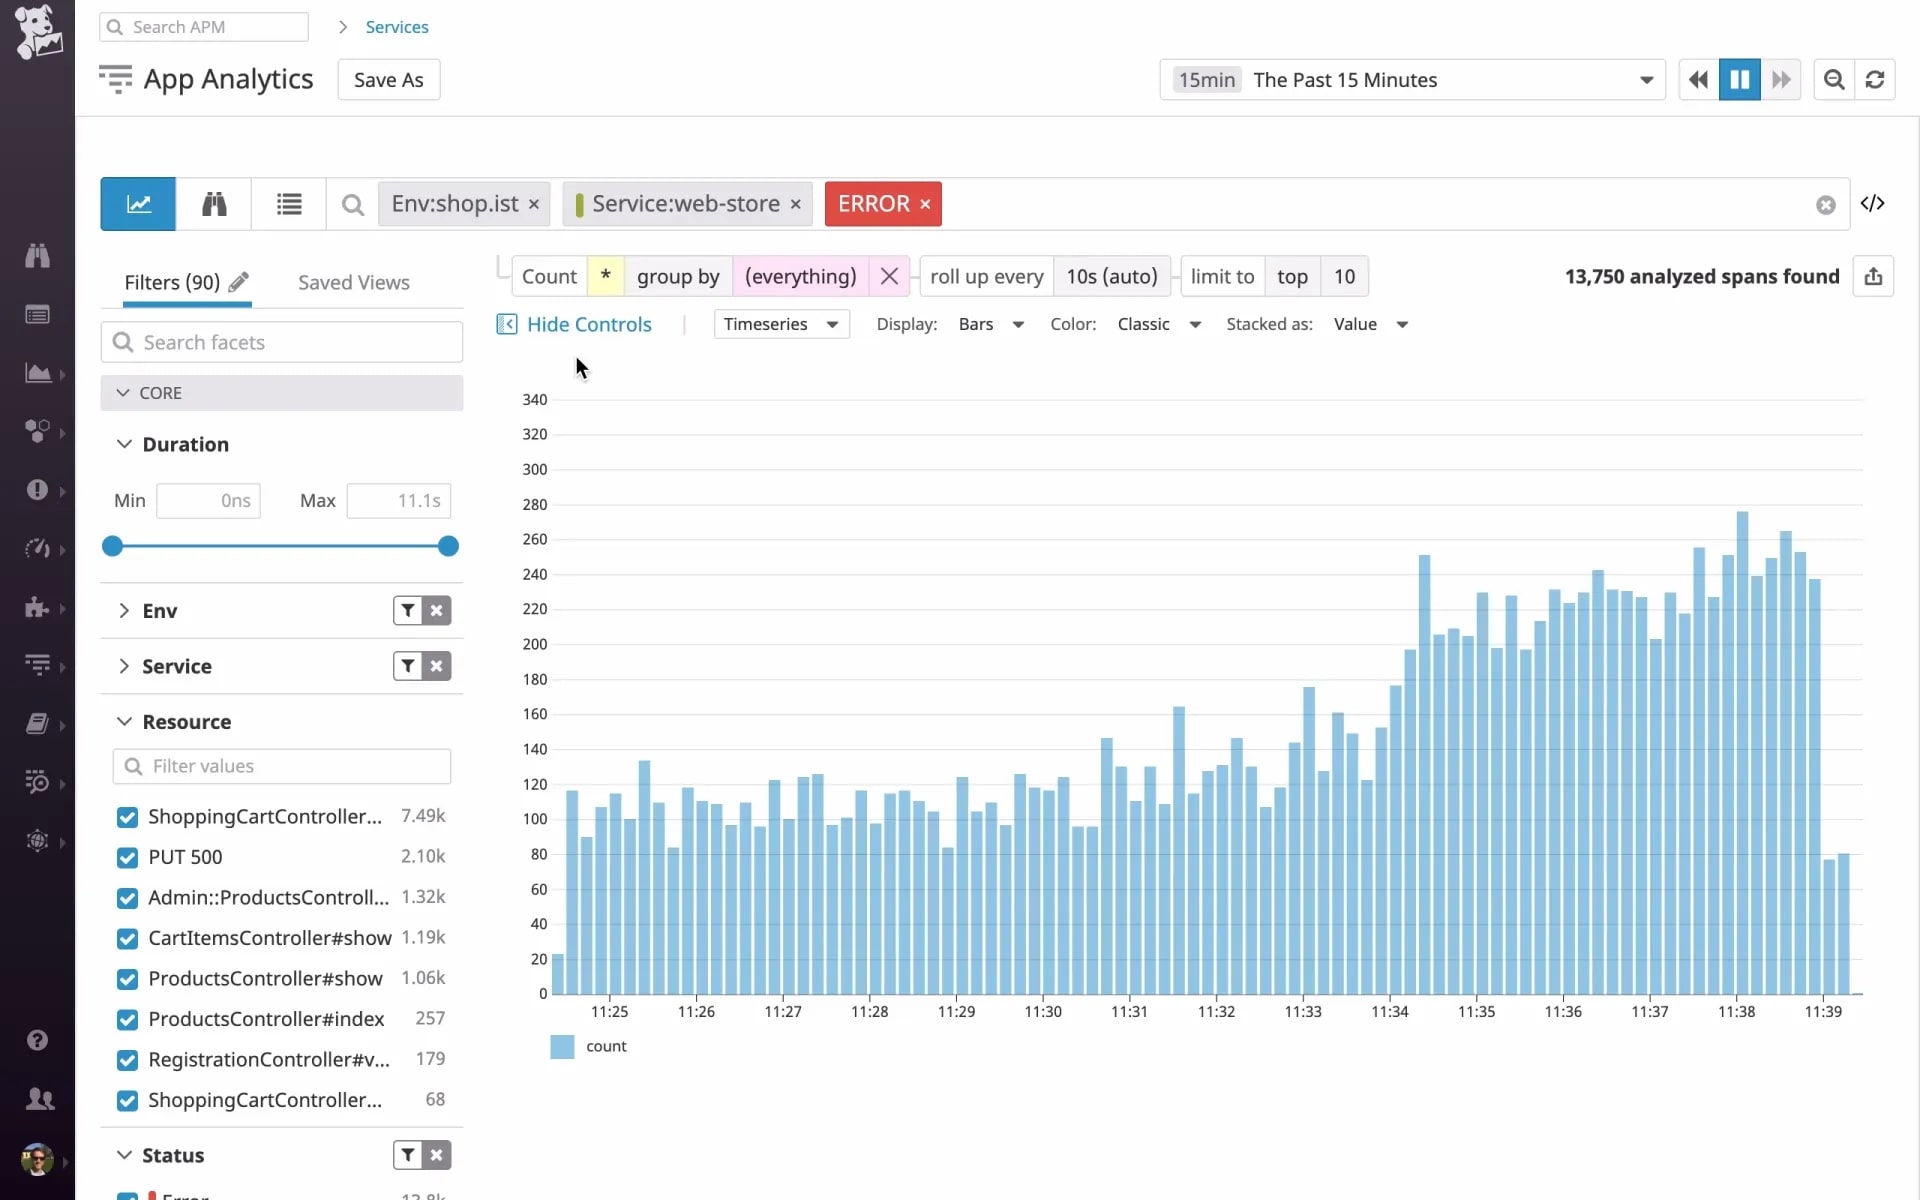
Datadog
To improve your application, Datadog APM helps you examine and identify dependencies, eliminate bottlenecks, decrease latency, track mistakes, and boost code efficiency. Distributed traces easily integrate with browser sessions, logs, profiles, synthetic tests, process-level data, and infrastructure metrics, providing comprehensive insight into the health of your application across all hosts, containers, proxies, and serverless services.
Features:
Correlate application performance to logs and underlying infrastructure parameters in real-time using a single integrated platform.
- Tracing Without Boundaries: Search and analyze all traces in real-time (no sampling) and preserve just those relevant to you using tag-based heuristics.
- Continuous Profiling: Analyze code-level performance throughout your stack with little effort, utilizing tags to identify the most resource-intensive methods (CPU, memory, etc.) and correlating them to relevant requests and traces.
- Synthetics and Real User Monitoring (RUM): Measure and enhance your front-end applications' speed and end-user experience in real-time or through simulated controlled browser and API tests and correlate them with relevant traces, logs, and infrastructure data.
Conclusion
APM enables you to collect real-time performance data from an end user's viewpoint, rather than depending on second or third-order metrics concerning host or network usage, to better understand the performance of your application, whether it is on-premise SAAS or cloud-based.
APM is used to monitor critical app performance indicators related to a web application's performance in production. It is a second wave of performance monitoring tools that followed conventional host-based monitoring. Monitoring at the host level focused on storage, memory, CPU, and network usage. Application monitoring, which should prioritize infrastructure monitoring, takes it further by focusing on the application's actual "end-user" metrics in real-time, such as code-level defects, response time slowdowns, and error rates.
We must monitor the system's performance, just like we do with other systems, to verify that it is appropriately managed and providing the expected results. Metricfire is one of the most often used tools for monitoring performance. Our hosted version of Prometheus, which includes two years' worth of data storage, the whole Grafana visualization tool, and much more, is available at MetricFire. Our solution is easy to set up and can provide you with plenty of information about your environments.
You can learn more about it by scheduling a demo or signing up for a free trial.


