
Table of Contents
Great systems are not just built. They are monitored.
MetricFire is the fully managed Graphite and Grafana platform for small teams that don’t want to self-host their monitoring stack. Pre-built dashboards, alerts, and native add-ons for Heroku, AWS, Azure, and GCP. All with dedicated support and no infrastructure to maintain.
Introduction
Apache Flink is an open-source, distributed stream processing engine built for real-time, high-throughput data pipelines. It excels at processing continuous data streams with low latency, making it a great fit for use cases like fraud detection, log analytics, real-time dashboards, personalized recommendations, and IoT telemetry.
In production, companies use Flink to analyze financial transactions as they happen, process user behavior streams for live metrics, or trigger alerts from incoming sensor data. Flink supports both streaming and batch workloads, with strong guarantees like exactly-once state consistency and fault tolerance through checkpointing. Its APIs, ability to scale horizontally, and native integration with tools like Kafka and S3, make it a great solution for building reliable systems that react to data as it’s generated.
In this guide, we'll detail how to install Flink and the OpenTelemetry Agent to collect and forward performance metrics to a datasource.
1. Install and Configure Flink
If you're already running an instance of Apache Flink in your production or test environment, you can jump straight to the OTel configuration section. Otherwise, the following section provides a quick setup guide to install and run Flink in a Linux environment. Apache Flink requires Java 8 or higher to run, with official support up to Java 17 for optimal compatibility and performance.
Install and Unpack Flink (Linux)
wget https://downloads.apache.org/flink/flink-1.18.1/flink-1.18.1-bin-scala_2.12.tgz
sudo tar -xzf flink-1.18.1-bin-scala_2.12.tgz

cd flink-1.18.1
Configure Flink and Allow Outbound Traffic
Flink has a handy browser UI that connects to your server, so you must configure it to allow outbound IP traffic. Just open your configuration file (generally located at: /conf/flink-conf.yaml), update the rest.address line from localhost => 0.0.0.0 and save.
If needed, you can also update your ufw firewall rules to allow 8081/tcp:
sudo ufw allow 8081/tcp
2. Run and Test Flink
Start a Local Cluster
To start a local Flink cluster, use the built-in start-cluster.sh script, which launches both the JobManager and TaskManager processes on the same machine. This setup allows you to run and test Flink jobs locally in a standalone mode without needing a distributed environment.
sudo ./bin/start-cluster.sh
Now just confirm that it's running on the default port :8081
sudo lsof -i :8081
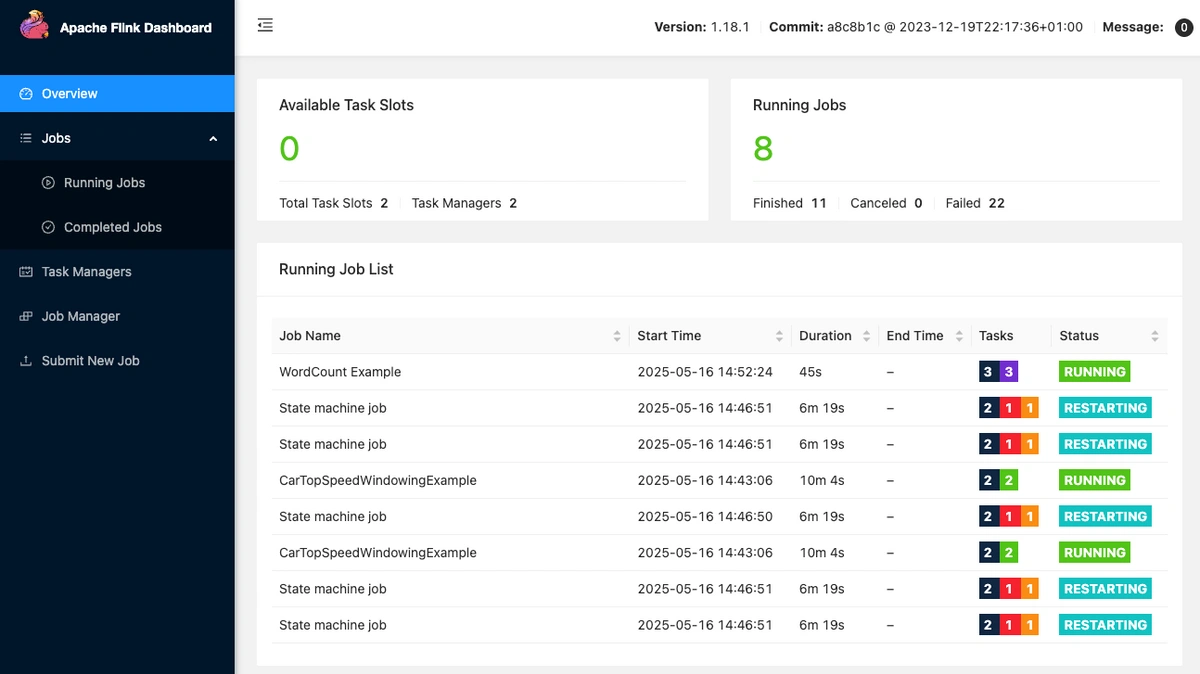
Access the Interactive Flink Browser UI
Apache Flink offers a built-in browser UI that provides real-time visibility into job execution, system metrics, and task status. It's useful for monitoring running jobs, debugging performance issues, and verifying that your cluster and TaskManagers are operating correctly. Just navigate to the following address in your browser:
http://<your-server-IP>:8081/
3. Install and Configure OpenTelemetry
OpenTelemetry as a Collector has built-in Receiver plugins for HAProxy, NGINX, PostgreSQL, Redis, MongoDB, Kafka, Elasticsearch, RabbitMQ, and many more! These Receivers pull key performance metrics directly from your services with no manual parsing or custom scripts needed. This article assumes you're already using OpenTelemetry in your technology stack, but below are examples of how to install & configure otelcol-contrib to collect system-level metrics and export them to a storage endpoint.
Install OpenTelemetry Collector Contrib (Linux)
If you don't already have an instance of OpenTelemetry running on your OS, install our handy HG-CLI tool to get it up and running quickly:
curl -s "https://www.hostedgraphite.com/scripts/hg-cli/installer/" | sudo sh
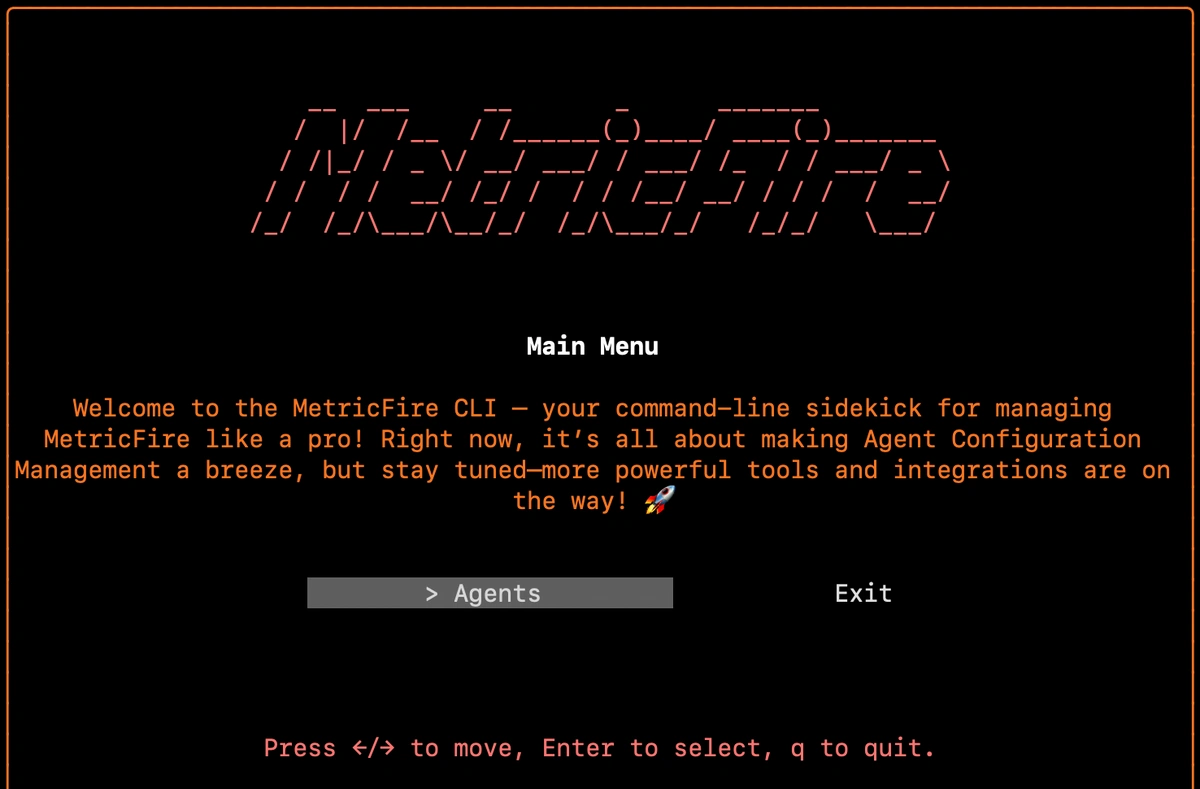
Once the tool is installed, just run it in TUI mode (hg-cli tui), enter your HG API Key, and follow the prompts to install the OTel agent:
Confirm Installation
otelcol-contrib --version
Configure the Flinkmetrics Receiver
The Flinkmetrics Receiver in OpenTelemetry collects connection performance metrics, processes them, and forwards them to your exporter of choice.
The Carbon Exporter takes those metrics and ships them straight to Graphite-compatible backends, making it easy to integrate OTel into existing monitoring stacks with minimal setup.
If you're not currently hosting your own Graphite data source, start a 14-day free trial with Hosted Graphite by MetricFire to continue following along with this example!
A MetricFire account will provide the Graphite data source and include Hosted Grafana as a visualization tool, along with robust Alerting, Integrations, and Team features.
- First, find and open the OTel configuration file, generally located at: /etc/otelcol-contrib/config.yaml
- Then update the file to include the flinkmetrics receiver block, endpoint, and define it in the service => receivers block
- If you used the HG-CLI tool to install OTel, your <HG-API-KEY> and <HOSTNAME> will already be configured
receivers:
 flinkmetrics:
  endpoint: http://localhost:8081

...

service:
  pipelines:
    metrics:
      receivers:
        - flinkmetrics
Now, just save the file and restart the otelcol-contrib service:
sudo systemctl restart otelcol-contrib
sudo systemctl status otelcol-contrib
Or you can serve the file manually to troubleshoot potential configuration errors:
otelcol-contrib --config /etc/otelcol-contrib/config.yaml
Ship Tagged Graphite Metrics
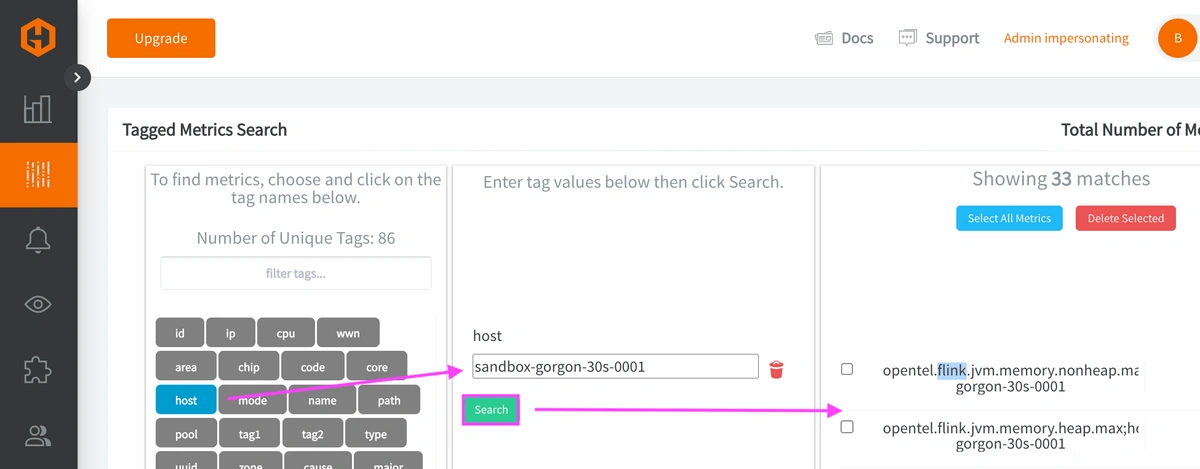
Within two minutes of restarting the otelcol-contrib service, a set of Tagged Graphite metrics will be forwarded to your Hosted Graphite account (with the opentel.flink prefix).
Why does OpenTelemetry export Tagged metrics to Carbon?
- "Because it's core model aligns more with Prometheus-style 'labels' than Graphite's 'dot notation' formatting. Instead of flattening data into long metric names, it preserves the labels by using Graphite tags, which also enables richer filtering in your Graphite backend."
Now you can locate these Tagged Metrics in the Hosted Graphite Tag Search UI - under the host tag:
Otherwise, you can configure a different exporter to forward metrics to another data source.
4. Run Some Tests in Flink
The following tests will simulate some real-world activity to observe how different jobs affect your metric values.
WordCount Example Job
This command runs Flink's built-in WordCount example job ten times in a loop. The job reads the contents of the LICENSE file, counts how often each word appears, and writes the results to a new output file each time (e.g., /tmp/output_1.txt, etc.). It’s a simple batch processing task that tests Flink’s execution, verifies your cluster setup, and generates metric activity like job counts & resource usage.
for i in {1..10}; do
  sudo ./bin/flink run ./examples/batch/WordCount.jar --input ./LICENSE --output /tmp/output_$i.txt
done
TopSpeedWindowing Streaming Job
The TopSpeedWindowing example is a streaming job that simulates car sensor data and calculates the top speed per car in 10-second windows. Running it multiple times helps generate real-time load on Flink, making it useful for testing streaming metrics and system performance.
for i in {1..5}; do
  sudo ./bin/flink run ./examples/streaming/TopSpeedWindowing.jar &
done
StateMachineExample Streaming Job
The StateMachineExample streaming job simulates events triggering transitions between defined states in a system, such as a user moving from “logged out” to “logged in” or a device changing status. By running it several times, you create parallel state transition streams that help test Flink’s ability to manage keyed state, event processing, and real-time updates across multiple jobs.
for i in {1..3}; do
  sudo ./bin/flink run ./examples/streaming/StateMachineExample.jar --jobname statemachine_$i &
done
5. Use Hosted Graphite by MetricFire to Create Custom Dashboards and Alerts
Hosted Graphite by MetricFire is a monitoring platform that enables you to gather, visualize, and analyze metrics and data from servers, databases, networks, processes, devices, and applications. Using MetricFire, you can effortlessly identify problems and optimize resources within your infrastructure.
Metrics sent to the public carbon endpoint will be timestamped and aggregated into the Hosted Graphite backend.
-
OpenTelemetry metrics will be sent and stored in the Graphite Tag format of: my.series;tag1=value1;tag2=value2 metric_value (timestamp)
-
The tags provide a filtering option, making the metrics efficient to query
-
Metrics are stored in your Hosted Graphite account for two years, and you can use them to create custom Dashboards and Alerts.
Build Custom Dashboards in MetricFire's Hosted Grafana
In the Hosted Graphite UI, navigate to Dashboards and select + New Dashboard to create a new visualization.
Then go into Edit mode and use the Query UI to select a graphite metric path (the default data source will be HostedGraphite if you are accessing Grafana via your HG account).
NOTE: To query Tagged Graphite metrics, you must apply the seriesByTag Graphite function.
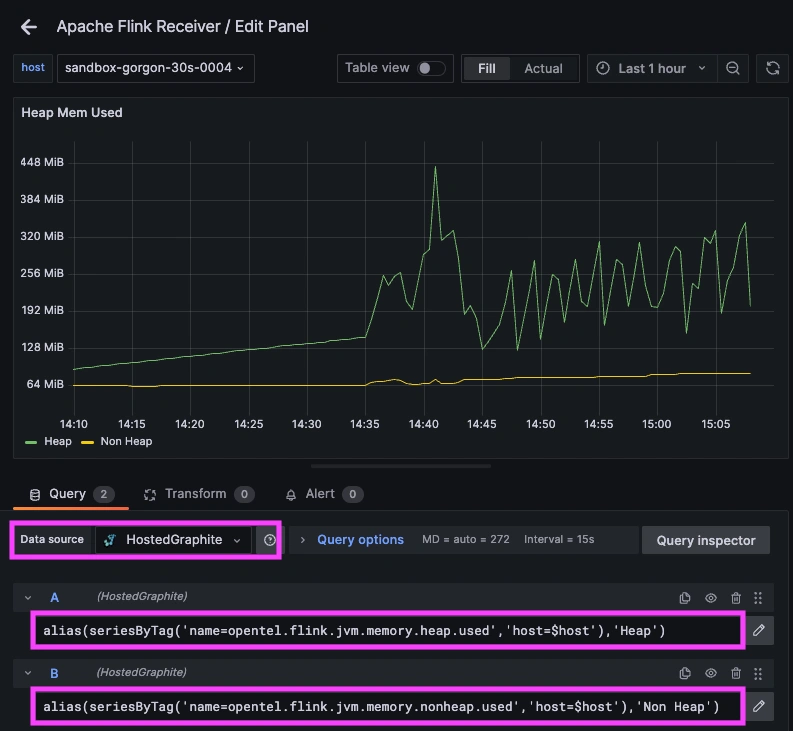
Grafana has many additional options to apply different visualizations, modify the display, set units of measurement, and some more advanced features like configuring dashboard variables and event annotations. Here is an example dashboard that uses metrics collected by the OTel Flinkmetrics Receiver:
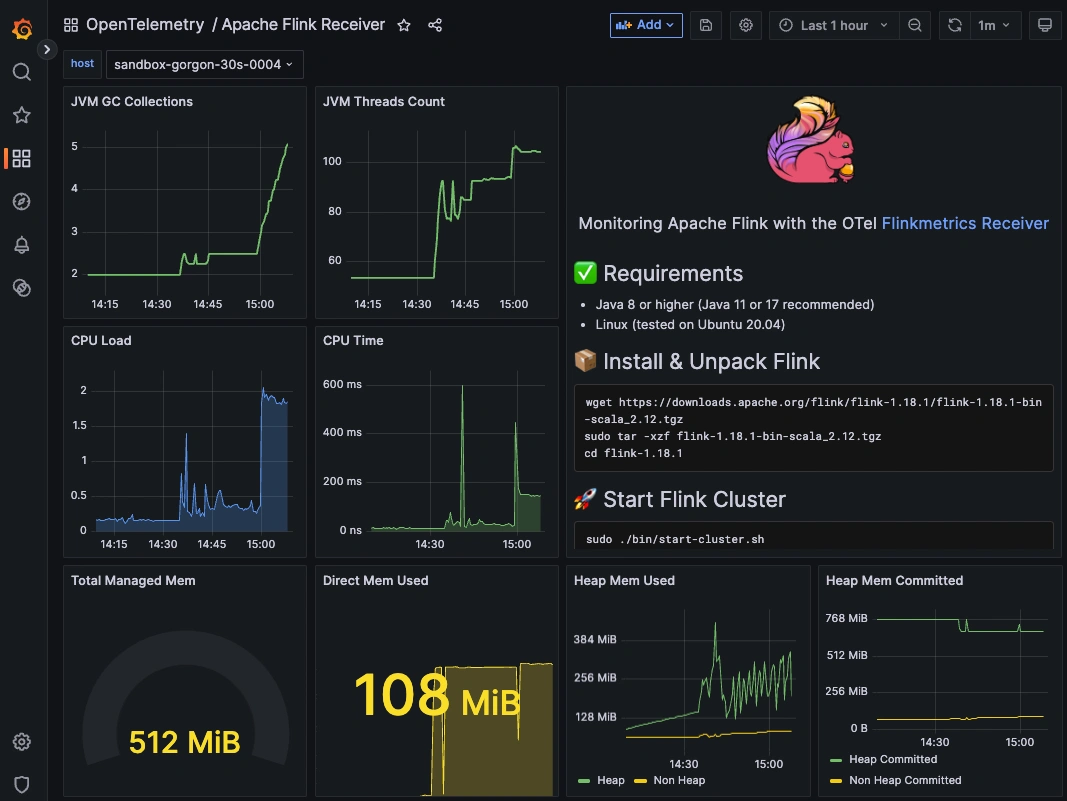
See the Hosted Graphite Dashboard docs for more details around building custom Grafana visualizations.
Creating Graphite Alerts
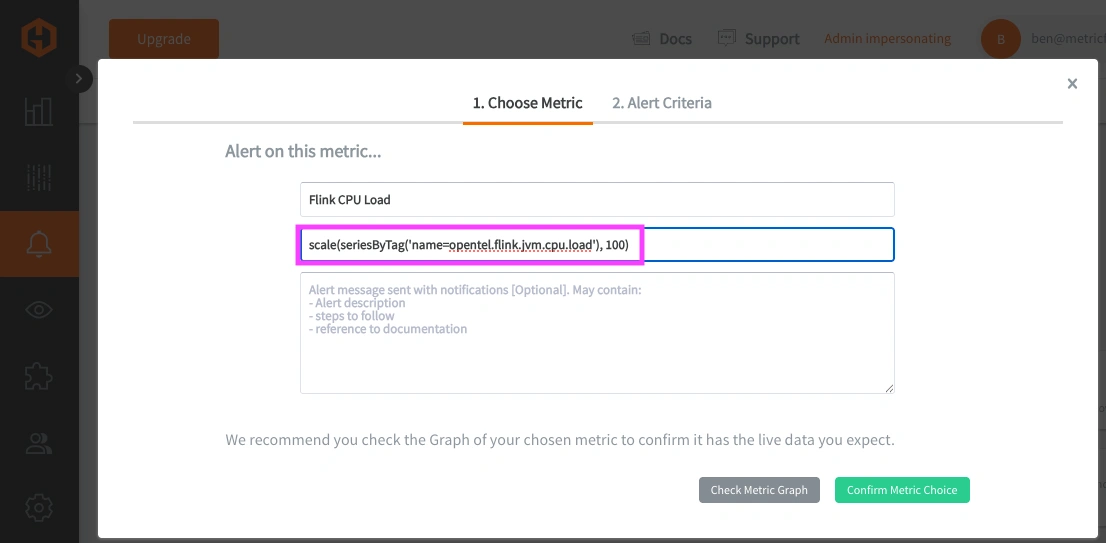
In the Hosted Graphite UI, navigate to Alerts => Graphite Alerts to create a new alert. Name the alert and add a Tagged Flink Metric to the alerting metric field:
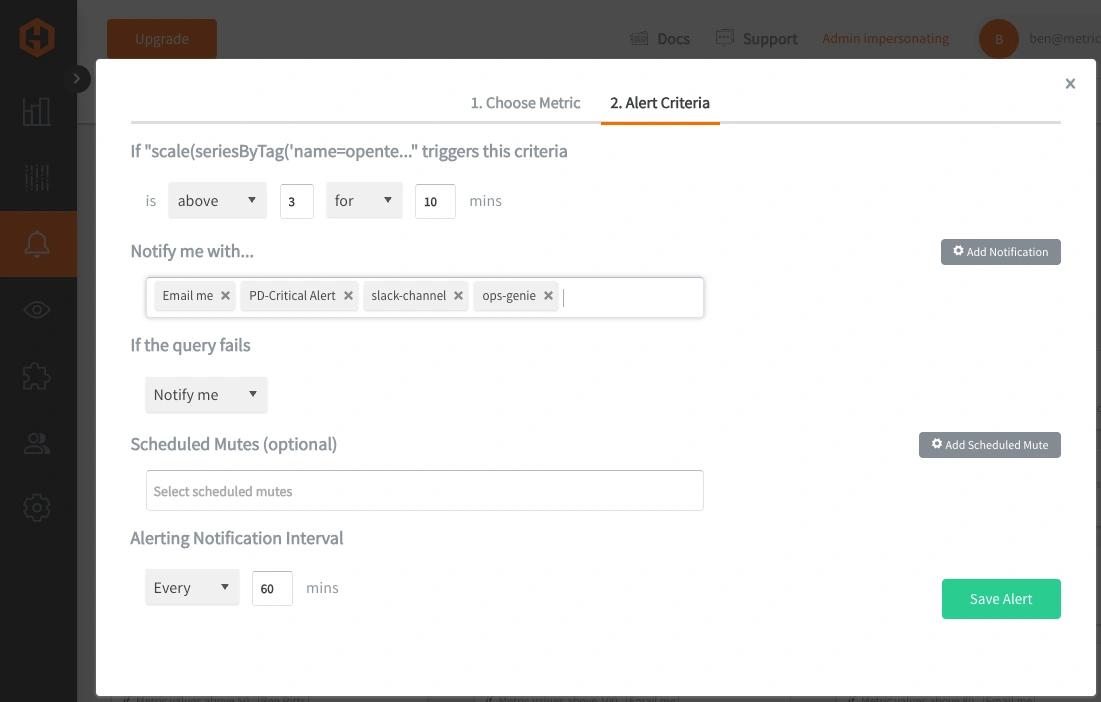
Then, select the Alert Criteria tab to set a threshold and select a notification channel. The default notification channel will be the email you used to sign up for the Hosted Graphite account. Still, you can easily configure channels for Slack, PagerDuty, Microsoft Teams, OpsGenie, custom webhooks, and more. See the Hosted Graphite Notification Channels docs for more details:
Conclusion
Apache Flink enables businesses to process and react to real-time data, powering use cases like fraud detection, customer analytics, and operational automation. Because Flink handles high-throughput, stateful workloads, monitoring its performance is critical to ensure jobs run reliably and efficiently. By integrating Flink with OpenTelemetry and a backend like Hosted Graphite by MetricFire, DevOps teams gain the visibility needed to optimize performance, troubleshoot issues quickly, and keep real-time data systems healthy at scale.
Sign up for the free trial and begin monitoring your infrastructure today. You can also book a demo and talk to the MetricFire team directly about your monitoring needs.


