
Table of Contents
Great systems are not just built. They are monitored.
MetricFire runs Graphite and Grafana as a fully managed service for growing engineering teams, taking care of storage, scaling, and version updates so your team doesn't have to. Plans start at $19/month, billed per metric namespace rather than per host, and include engineer-staffed support. Integrations work natively with Heroku, AWS, Azure, and GCP, and data is stored with 3× redundancy in SOC2- and ISO:27001-certified data centres.

Introduction
In the fast-evolving landscape of technology and software applications, ensuring optimal performance and reliability has become paramount. This article delves into two powerful tools that facilitate effective monitoring and management of digital systems: Prometheus and AppDynamics. With a focus on different aspects of application performance, these tools offer distinct advantages to businesses aiming to elevate their user experiences and operational efficiency.
Key Takeaways
- Prometheus is an open-source service monitoring system built around a time series database, offering data storage, querying, graphing, and built-in alerting. Its flexible data model and PromQL query language empower users to derive meaningful insights.
- AppDynamics excels in real-time anomaly detection, suitable for cloud or server-based apps. With its Business iQ feature, it correlates app performance with business outcomes, allowing for a comprehensive understanding of impact.
- The article offers a thorough comparison of both solutions, aiding readers in selecting the monitoring tool that best suits their specific needs and business objectives.
- Regardless of the choice, both Prometheus and AppDynamics contribute to empowered digital experiences by ensuring optimal application performance, user satisfaction, and operational efficiency.
What is Prometheus?
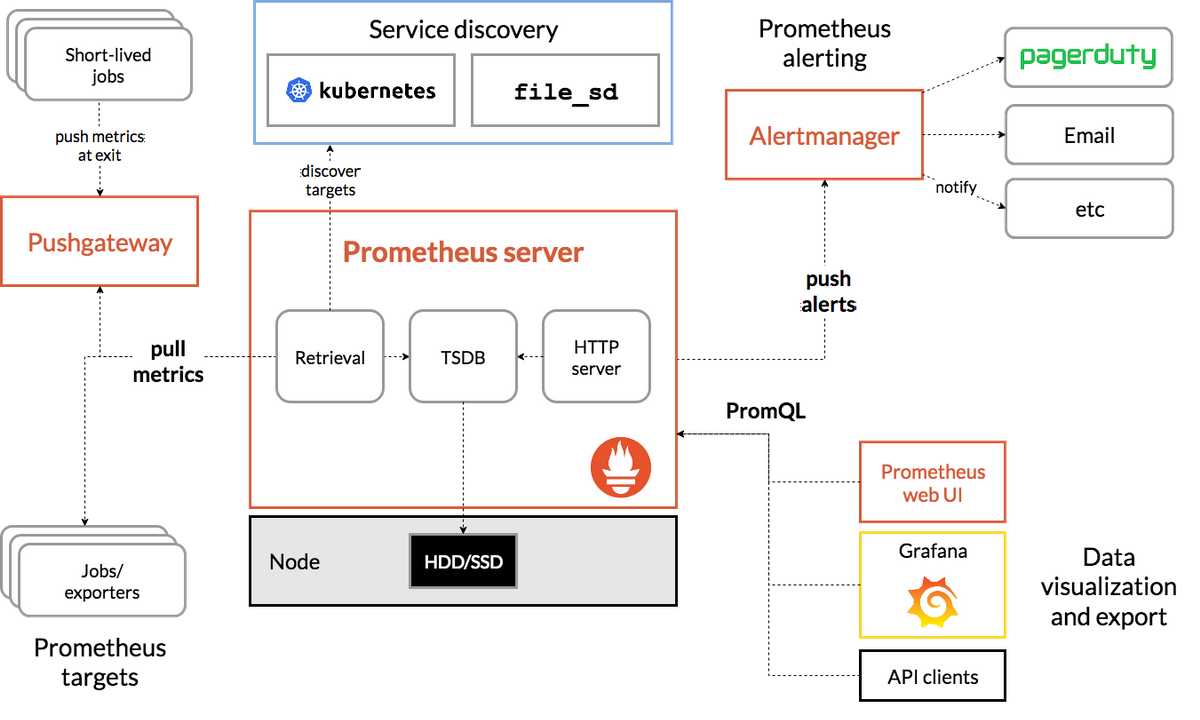
Prometheus is an open-source service monitoring system built around a time series database, able to receive data and store it, in addition to supporting queries, graphs, and in-built alerting. Connecting to target endpoints to request metrics via HTTP, Prometheus provides a multi-dimensional data model wherein metrics can be defined by names and/or tags which identify them as part of a unique time series. Open-source Prometheus metrics have a default retention of 15 days. The Prometheus query language (PromQL) can then be used to explore metrics and draw simple graphs.
Get our free trial and start using our Prometheus alternative in minutes. You can see if Prometheus is the right fit for you. If you have any questions, you can always book a demo and talk to us directly.
What is AppDynamics?
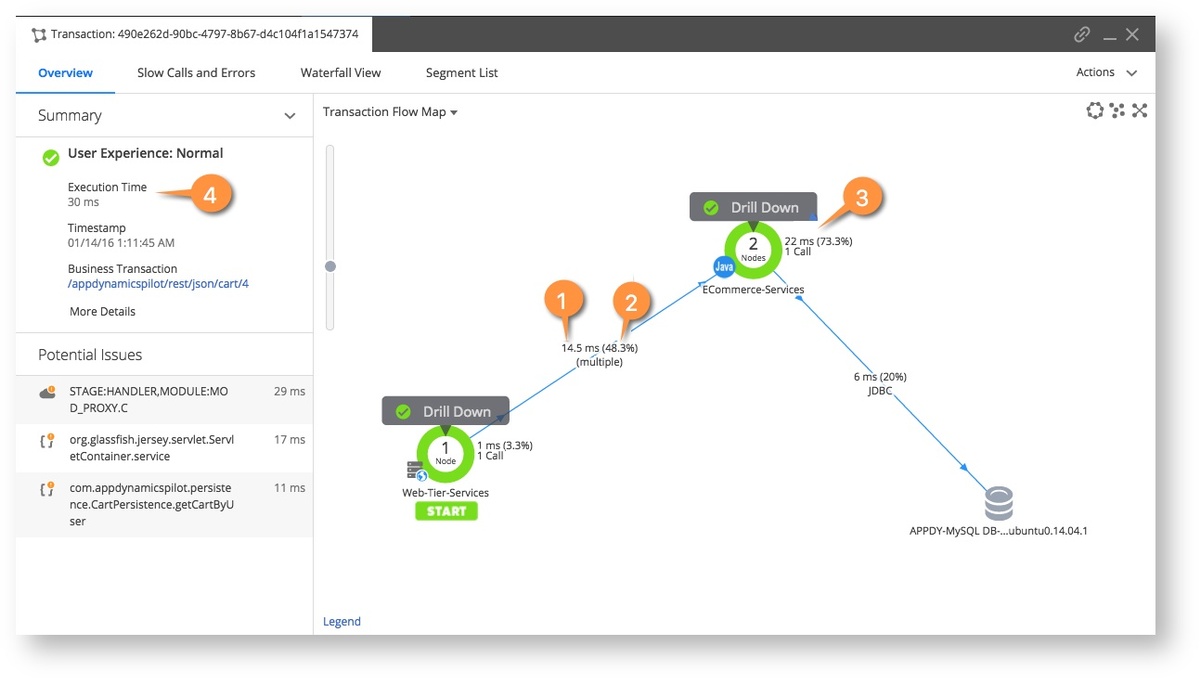
AppDynamics is an application performance monitoring tool designed to provide real-time detection of anomalies. It can be applied for both cloud or server-based apps, and can also be used to see how your app’s performance can affect business metrics. AppDynamic’s feature called Business iQ allows you to correlate app performance, user experience, and business outcomes. AppDynamic’s end-user monitoring tool allows for a correlation between front-end and back-end performance monitoring. Infrastructure Monitoring allows for visibility into how the infrastructure impacts the app performance. AppDynamic is a proprietary service with three stages of pricing. The first stage is only app performance monitoring, the second stage is full-stack visibility, and the third stage brings in Business iQ.
When to use AppDynamics?
Use AppDynamics when you …
- have an app that needs to be monitored.
- are looking for ways to optimize your app.
- want to know where the anomalies in your app are.
- want to identify which anomalies actually affect user experience.
- want to be able to trace how much anomalies are costing.
Pricing comparison
- Prometheus is open-source, and free.
- AppDynamics has a starting price of 3300 USD per year.
Key takeaways
- Prometheus can provide a dimensional data model where metrics are identified by a metric name and tags with built-in storage, graphing, and alerting.
- Prometheus is open-source and free.
- AppDynamics is meant for businesses that are defined by their app services.
Get a free trial and start using Hosted Graphite by MetricFire now. Feel free to book a demo if you have questions about what Hosted Graphite can do for you.


