
Table of Contents
Great systems are not just built. They are monitored.
MetricFire runs Graphite and Grafana as a fully managed service for growing engineering teams, taking care of storage, scaling, and version updates so your team doesn't have to. Plans start at $19/month, billed per metric namespace rather than per host, and include engineer-staffed support. Integrations work natively with Heroku, AWS, Azure, and GCP, and data is stored with 3× redundancy in SOC2- and ISO:27001-certified data centres.
Introduction
It is an old cliche adage, but there is no better statement than “a picture is worth a thousand words” that explains the effectiveness of visuals to deliver a message. Especially, in the data domain where a raw message often exists in numbers, visualizing graphs and charts is the best way to share information. When it comes to visualizing metrics from Graphite, there is no solution that can beat Grafana. In this article, we will find out the best Grafana dashboards to visualize Graphite metrics and learn about Grafana and Graphite in general.
Before we begin, check MetricFire. MetricFire offers comprehensive monitoring solutions with Hosted Grafana and Hosted Graphite. You can gain in-depth insight into your IT resources with minimal configuration. If you want to learn more, book a demo with us, or sign on to the free trial today.
Key Takeaways
- Grafana is the best tool for visualizing Graphite metrics, offering effective data visualization through graphs and charts.
- The article highlights five inspiring Grafana dashboards for Graphite metrics: network monitoring, traffic flow analysis, IoT, Kubernetes node metrics, and server load monitoring.
- Graphite is an open-source monitoring software for real-time graphing and tracking performance.
- Sending metrics to Graphite is simple, storing data in a Whisper database on the server's file system.
- Grafana is an open-source analytics and visualization tool with features like dashboard templates, annotations, custom plugins, alerting, and SQL support.
What Is Grafana?
Grafana is a powerful and popular open-source data visualization and monitoring platform. It allows users to create visually appealing and interactive dashboards that consolidate and present data from various sources. Grafana supports a wide range of data storage solutions, including popular databases, cloud services, and time-series databases. With its intuitive interface and extensive library of plugins and integrations, Grafana enables users to explore, analyze, and gain insights from their data in real time. It offers flexible visualization options such as charts, graphs, tables, and heatmaps, making it suitable for monitoring system performance, network metrics, application data, and more. Whether used by developers, system administrators, or data analysts, Grafana empowers users to effectively monitor, understand, and optimize their systems and applications.
5 Best Grafana dashboards for Graphite metrics
Building a dashboard requires not only a deep understanding of your target metrics but also people’s creativity for designing intuitive dashboards. If you can refer to an established dashboard design or, even better, simply import that design into your future dashboard, it can shorten the time-consuming job significantly. In this section, we will have a look at the best Grafana dashboards so that you can get some inspiration for your upcoming design.
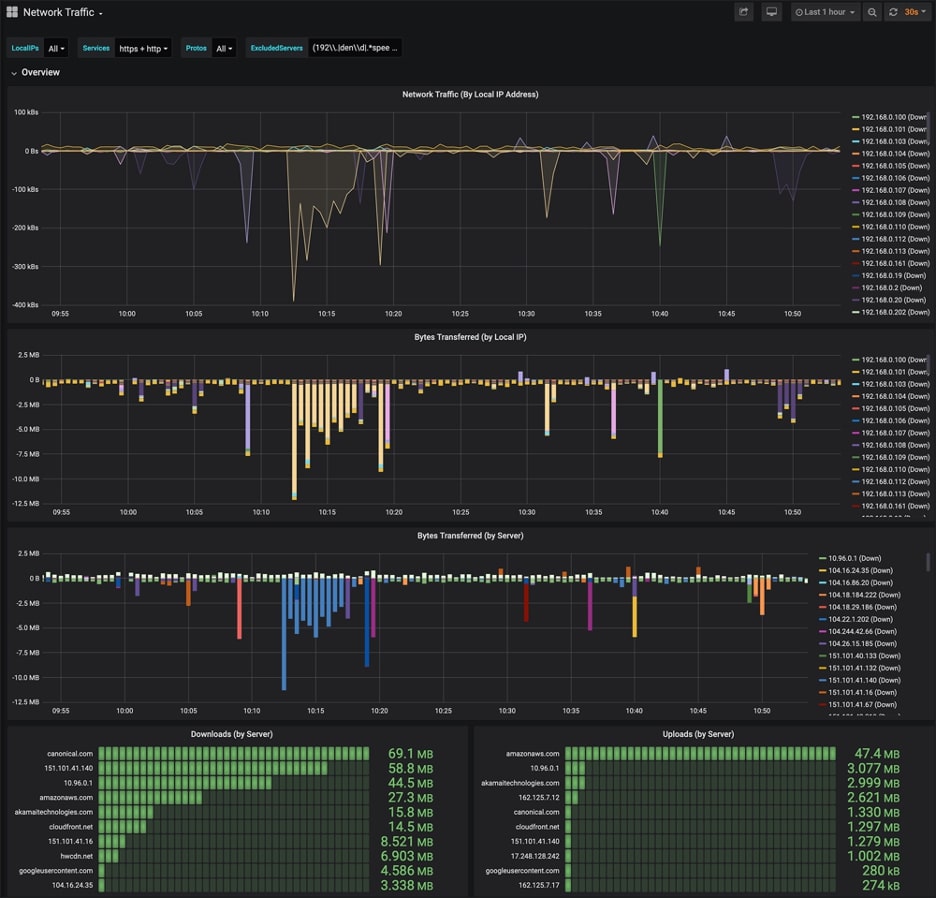
Network Monitoring Dashboard
This dashboard is designed for network monitoring specifically. In network monitoring, you will want to make sure all connected devices can access with optimal speed. In a shared environment, if some devices consume network bandwidth excessively, it can adversely affect others by slowing down overall speed. Monitoring network traffic by IP address can give you great visibility and allow you to pinpoint the places to investigate. This network monitoring dashboard has a time-series network traffic view at the top. Also, you can check the download and upload traffic volume by each source.
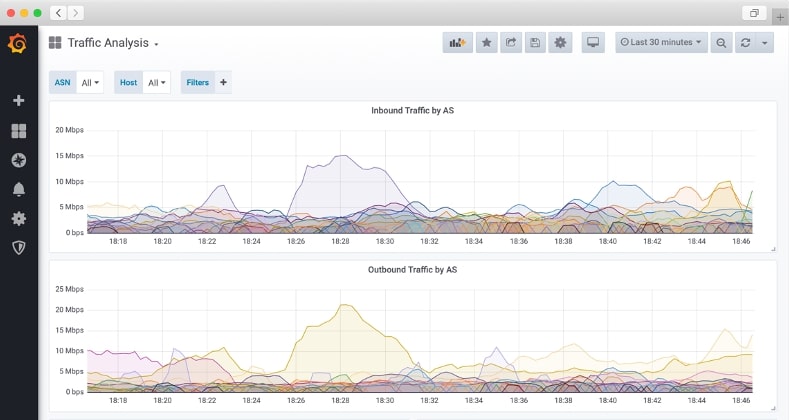
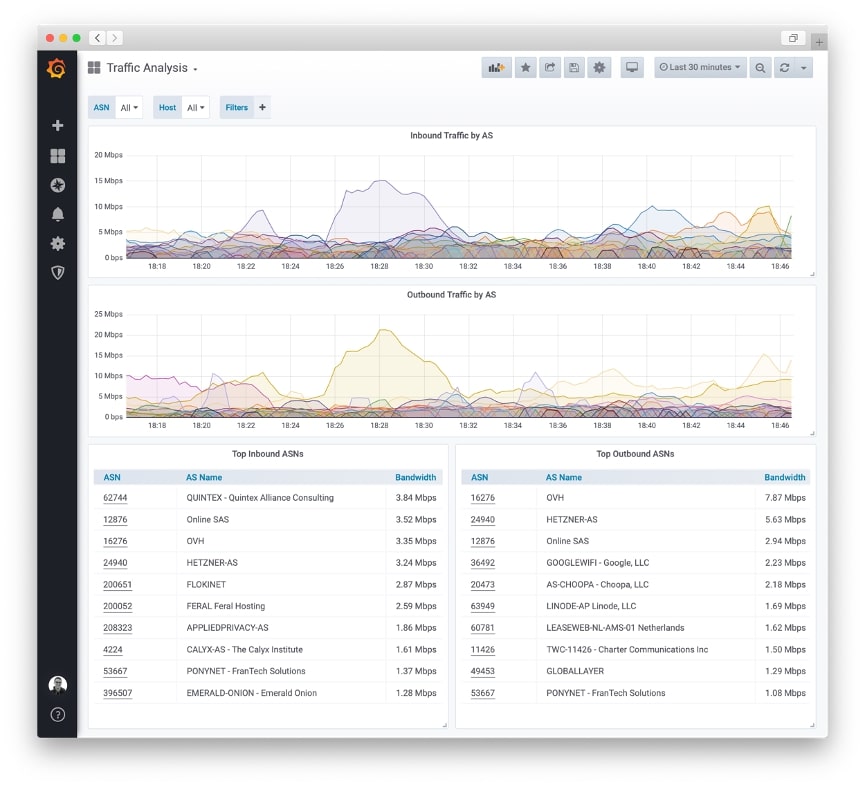
Network Traffic Flow Analysis Dashboard
This dashboard also shows network traffic but it has more focus on traffic exchanges between two network devices. The dashboard allows you to search the data by an ASN (Autonomous System Number) and to filter the host that processed the flow.
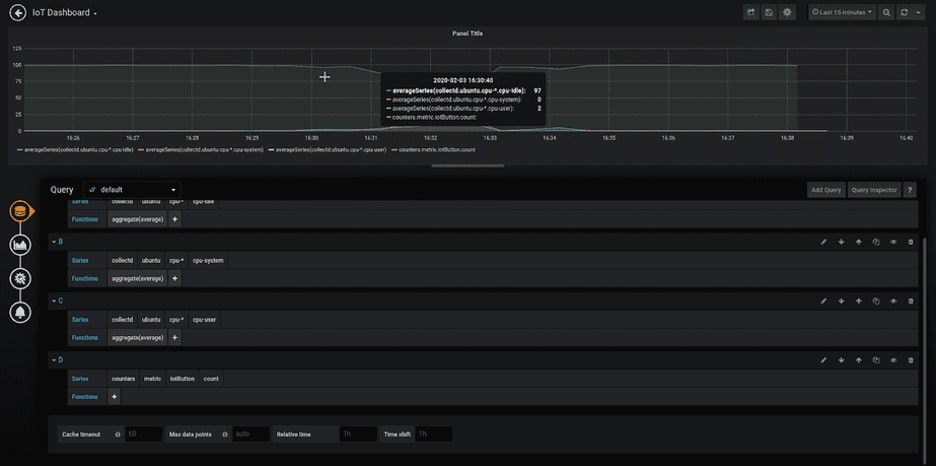
IoT (Internet of Things) Dashboard
Internet-of-Things technologies and products started to be deeply embedded in our life. Industries and consumers adopt the technologies to manage their resources in a smart and efficient way. Implementing such innovative technologies requires a lot of effort and resources, but we also shouldn’t forget the importance of monitoring them. The most effective way of tracking IoT devices is visualizing metrics in time-series. The dashboard prepared by MetricFire shows step-by-step processes on how to set up the Grafana dashboard to monitor IoT devices and how to retrieve data from Graphite.
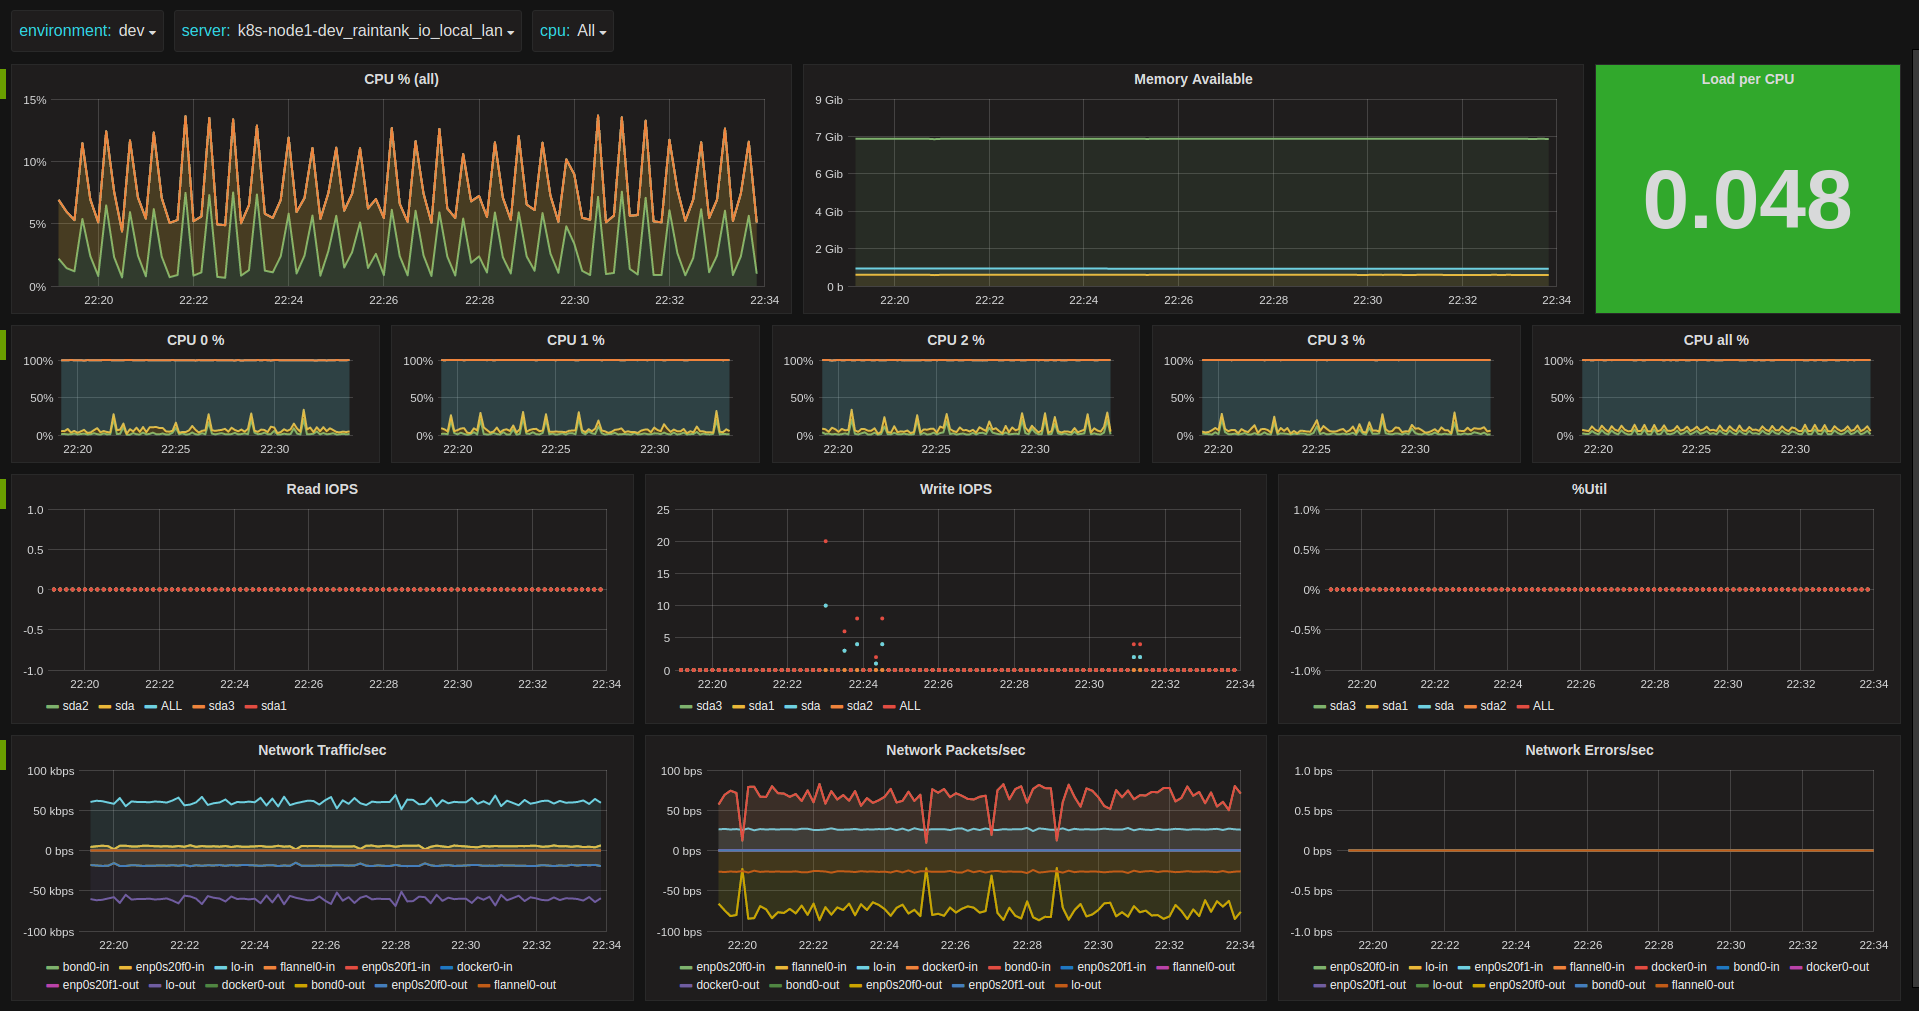
Kubernetes Node host metrics
This dashboard was designed to monitor Kubernetes node hosts. It provides summary performance and availability metrics of a Kubernetes node. The dashboard consists of multiple metrics that help you to understand your Kubernetes nodes. You can see CPU and memory usage in time-series. Also, you can see the read and write IOPS (Input / Output Per Second) metrics. With this single page dashboard, you can achieve great visibility.
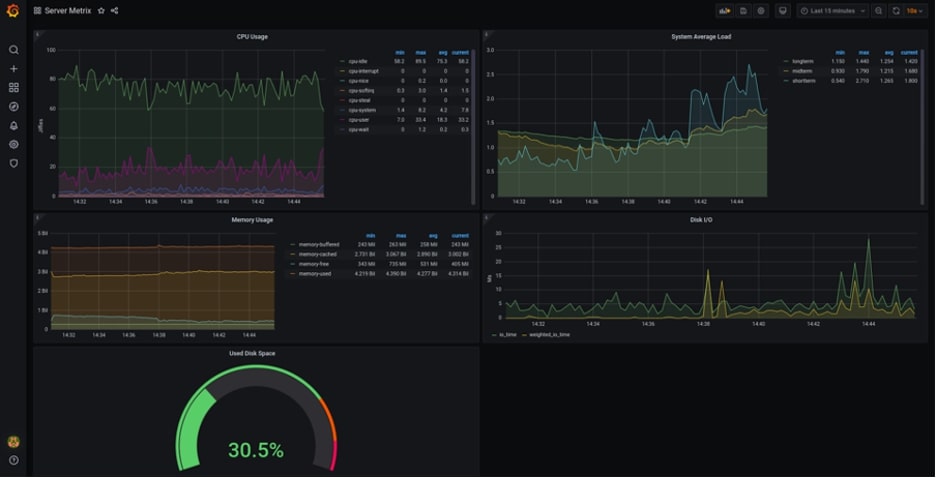
Server Load Monitor Dashboard
To monitor a server, we need to look at diverse metrics to have a complete view. Some of the critical metrics elements include CPU usage, memory, system load, disk I/O, storage, network throughput, and more. There is no more effective way than having a single page dashboard that displays all these monitoring elements. This server load monitor dashboard consists of all the critical metrics and you can see them in a single page.
What is Graphite?
Graphite is an open-source monitoring software that is designed to perform reliably on affordable hardware or cloud infrastructure. People use Graphite to track the performance of their resources such as websites, applications, network servers, and more. It is known to provide a scalable solution for real-time graphing. You can write an application that digests numeric time-series data and sends it to Graphite’s processing backend - carbon that stores the data in its database. Then, you can visualize the data on Graphite’s web interfaces.
How can we send metrics into Graphite?
To visualize the data that come from Graphite, you first need to send metric data into Graphite. Sending data into Graphite is straightforward. To give you the feel of what it is going to take, here are some examples to send it to Graphite.
$ echo "foo.bar 1 `date +%s`" | nc localhost 2003
The sample code above follows this syntax.
echo ${METRIC_NAME} ${NUMBER_OF_WAYWARD_PROCS} ${TIMESTAMP} | nc ${CARBON_HOST} ${CARBON_PORT}
With the command in your terminal, you can submit your measurement data into Graphite. Then, the metric will be stored in a Whisper database on your Graphite server’s file system. It’s persisted at:
<prefix>/storage/whisper/foo/bar.wsp
In most cases, your prefix is likely to be /opt/graphite. Graphite uses a dot-delimited name convention for metrics, graphs, and dashboards as well. Using the rules, you can conveniently group your metrics by application, server, datacenter, or person.
What is Grafana?
Grafana is also an open-source analytics and interactive visualization web application. You can customize charts, graphs, and alerts. On top of its visualization features, you can design its back end. With its extensive features, you can create customized dashboards and run queries to generate the metrics you want. Some of the major features include:
- Dashboard templates: you can write your dashboard design in templates as if you write code. Using the templates, you can reproduce the same design across different environments.
- Annotations: when you discover some patterns in your graph, you will often want to leave logs and comments. In Grafana, you can create manual or automatic annotations.
- Custom plugins: when you want to extend more features, you can utilize external plugins. These plugins enable you to, for example, add more graph types and manage dashboard users on a deeper level.
- Alerting: notifying users can be considered as a simple feature but without alerting, you can lose your sight on important incidents.
- SQL support: with SQL support, you can be flexible to retrieve metrics data from various database sources.
Using Graphite in Grafana
Grafana comes with an advanced Graphite query editor that allows you to quickly browse through the metric space. It also lets you add functions, change function parameters, and much more. The editor can handle all types of graphite queries. It can even accept complex nested queries through the use of query references. Selecting metrics and functions doesn't require much effort in Grafana. You can simply select your metrics name and a function you want to edit on the UI. You can also systematically assign query variables and set up annotations. Grafana provides many more options to control your metrics and visualization.
Hosted Grafana and Graphite
Grafana and Graphite both offer an extensive range of monitoring features and allow you to track performances of your IT resources in real-time. This real-time and time-series monitoring capability is an important factor for monitoring your infrastructure since you will want to know the latest status as fast as you can. In spite of the benefits, they can give you difficulty in maintenance due to the nature of open-source software. When you use an open source, starting from installation to implementation, all become your tasks. It will create an ongoing cost and require continuous efforts to keep them running smoothly.
If your objective is to visualize Graphite metrics on Grafana, using hosted Grafana and Graphite will be a perfect combination that will help you to reduce maintenance efforts and to let you focus on what matters the most to your teams. MetricFire provides hosting services for both monitoring solutions with flexible pricing plans. For teams needing to integrate this data with broader enterprise systems, DreamFactory offers a self-hosted platform providing governed API access to any data source, making it easier to connect your monitoring infrastructure with other enterprise applications and services.
Wrapping up
In this article, we had a look at five best Grafana dashboard designs and learned how Grafana and Graphite can help you in the monitoring domain. Also, we discussed the conveniences of hosted Grafana and Graphite. Using Grafana as a Service, you can focus on monitoring Graphite metrics more efficiently without having to worry about maintaining your monitoring infrastructure. Our hosted Grafana service gives you more control over your data and lets you have an optimal monitoring stack. Our expert support will lend helping hands whenever you need one.
To access all these services, visit MetricFire today and check our Grafana as a Service and hosted Graphite.