
Table of Contents
Great systems are not just built. They are monitored.
MetricFire is the fully managed Graphite and Grafana platform for small teams that don’t want to self-host their monitoring stack. Pre-built dashboards, alerts, and native add-ons for Heroku, AWS, Azure, and GCP. All with dedicated support and no infrastructure to maintain.
What is Network Monitoring?
Network monitoring is the process of looking after your network with the help of various tools and techniques. These tools that are often called network monitoring systems constantly track various aspects concerning your network, such as bandwidth usage, traffic, etc.
This tracking is important in case of outages as these systems notify the network administrator immediately. Moreover, network monitoring systems are essential for status updates so that you can improve your system’s efficiency. Let us now have a look at the commonly monitored metrics.
Later, we will explore the protocols used and how we could monitor it using Hosted Graphite. In the end, we will also display a couple of Grafana Dashboards to give you a sneak peek into the whole process.
Take control of your Graphite monitoring tool using MetricFire's Hosted Graphite to help you visualize your data. You should avail MetricFire's free trial today or book a demo with us and speak to our engineers!
Commonly Measured Metrics
1. Latency
The time it takes for a packet to get delivered once a request has been issued by a node or a system is called Latency. Consistent delays demonstrate performance bottlenecks and therefore, latency is an essential metric to monitor. It may seem overwhelming to monitor and log such amounts of data manually in real-time.
That's where network monitoring tools step in. They automate the whole process for you and even help in detecting errors overlooked by the human eye.
2. TCP retransmissions
At times when your network is experiencing performance issues, a packet may not be delivered the very first time it is requested. In such a case, the server retransmits the packets after a certain time out. Such retransmissions not only lead to packet loss but can also indicate network congestion.
This metric is imperative as the network administrator should be aware of how often a certain packet is dropped or how much time it takes to get delivered in order to evaluate the network’s overall performance.
3. Throughput
Throughput refers to the proportion of packets sent successfully from one point to another within your network. Bandwidth and throughput are often used interchangeably however, there is a difference between the two. The former represents a theoretical limit to the data that can be transferred within a channel while the latter is the actual amount of data being transmitted.
This implies that a higher bandwidth does not always guarantee a higher throughput since your network might be facing congestion leading to consistent packet losses. For the same reason, it is all the more important to monitor throughput as you want your retransmissions to be minimal.
4. Packet Loss
Packet loss indicates the number of packets lost during transmission across your network. Since a lost packet is not acknowledged, the network would send out a new packet fulfilling the request. However, packet loss, in general, implies congestion either on the receiver or the server-side.
As the number increases, the performance degrades. Therefore, the network administrator should keep an eye on this metric.
5. Server Response Time
The time it takes for a server to produce a response to an incoming request from an end-user is referred to as the Server Response Time. The metric is calculated as the difference between the first data packet generation and its delivery, confirmed by the acknowledgment packet (ACK).
This metric could be influenced by network congestion, severe load, etc. The reason why one should monitor this metric is that it gives an insight into how our network looks at an external level. This would help admins to resolve the situation for better efficiency and less delay.
Why are metrics monitoring important?
The cost incurred by the monitoring tools might seem additional or irrelevant at times. However, metrics monitoring is important to keep your system healthy and achieve optimal performance. When analyzed in aggregate, these metrics provide a holistic view of your system and help alert the network admins in case of emergencies.
Your business is at risk of losing millions in case the server goes down and although these network monitoring tools charge additional fees, they save a fortune in the longer run. Moreover, MetricFire’s hosted Graphite provides network solutions for your businesses at incredibly low costs.
Protocols for Network Monitoring
In this section, we will explore the two most common protocols used for Network Monitoring:
1. Simple Network Management Protocol (SNMP)
Much prevalent and conventional SNMP protocol is a part of the TCP/IP set. It is an application layer protocol mainly used to query relevant network elements in order to extract information shared among network devices. The collected information is then used to evaluate the overall efficiency.
It takes into account various aspects such as bandwidth usage, latency, resource utilization, etc. The pool of network devices that use SNMP includes switches, WLAN, modems, controllers, etc. Overall, the responsibilities of SNMP include information management and its communication to the network administrator.
The whole process involves responding to queries, taking actions based on incoming requests, and letting know when an event has occurred.
2. Internet Control Message Protocol (ICMP)
ICMP is a network-layer protocol used for sending error and control messages. Like SNMP, ICMP is also a subset of the TCP/IP stack. However, it emphasizes fault validation and is mainly used by routers and switches. While the error messages report anomalies during packet transmission, the control messages are responsible for conveying the status quo of the network devices involved.
ICMP is also used for metric calculations such as response time, accuracy, packet loss, etc. Due to its workflow, the protocol provides meaningful insights into error causes and detection.
Network Monitoring using Hosted Graphite and Grafana Dashboards
What kind of monitoring does Graphite support?
Graphite stores time-series data of all kinds and is, therefore, a great option for network monitoring. Since Graphite also offers rendering data and creating dashboards, it is ideal for monitoring metrics discussed earlier in this post.
Here are some use-cases that might come in handy:
- Monitoring Heroku App with Graphite
- Monitoring AWS server with Graphite
- Monitoring Redis Performance with Graphite
Graphite vs. Hosted Graphite?
Since Graphite is open-source, there are, of course, scalability and team sharing issues. Installing Graphite can be an exhaustive and cumbersome experience. Hosted Graphite is a better alternative to the conventional open-source Graphite.
MetricFire’s Hosted Graphite has a built-in Grafana feature which opens up a wide range of dashboarding options. Moreover, it has its own time-series database which helps multiple users to view sub-groups within their metrics simultaneously.
Addressing the scalability and team sharing issues, MetricFire’s Hosted Graphite comes up with an account-based system that makes it easier to share information among team members. Furthermore, it gives the flexibility to teams to control user access and sharing abilities.
MetricFire’s Hosted Graphite is versatile and adds up to the already existing functionality of the conventional Graphite. This fully serviced platform is not just another Network Monitoring tool. To find out what all can it be used for, visit here.
Here’s our post on Top Networking Tools, a collection of all kinds of tools available in one place.
Grafana Dashboards for Network Monitoring
In this section, we will go through some standard dashboards often used in Network Monitoring using Grafana. If you’re new to the field, a read on metric display using Graphite is recommended. As MetricFire’s services come with built-in Grafana for Data Visualization, we would be using the same in this section.
If you’d like to know more about our features, talk to one of our experts.
Grafana Dashboards are imported and exported in JSON format which contains every necessary detail such as layout, variables, queries, etc. Grafana’s community is growing and therefore, standard dashboards are more easily accessible. To know more about how to import/export a dashboard in Grafana, visit here.
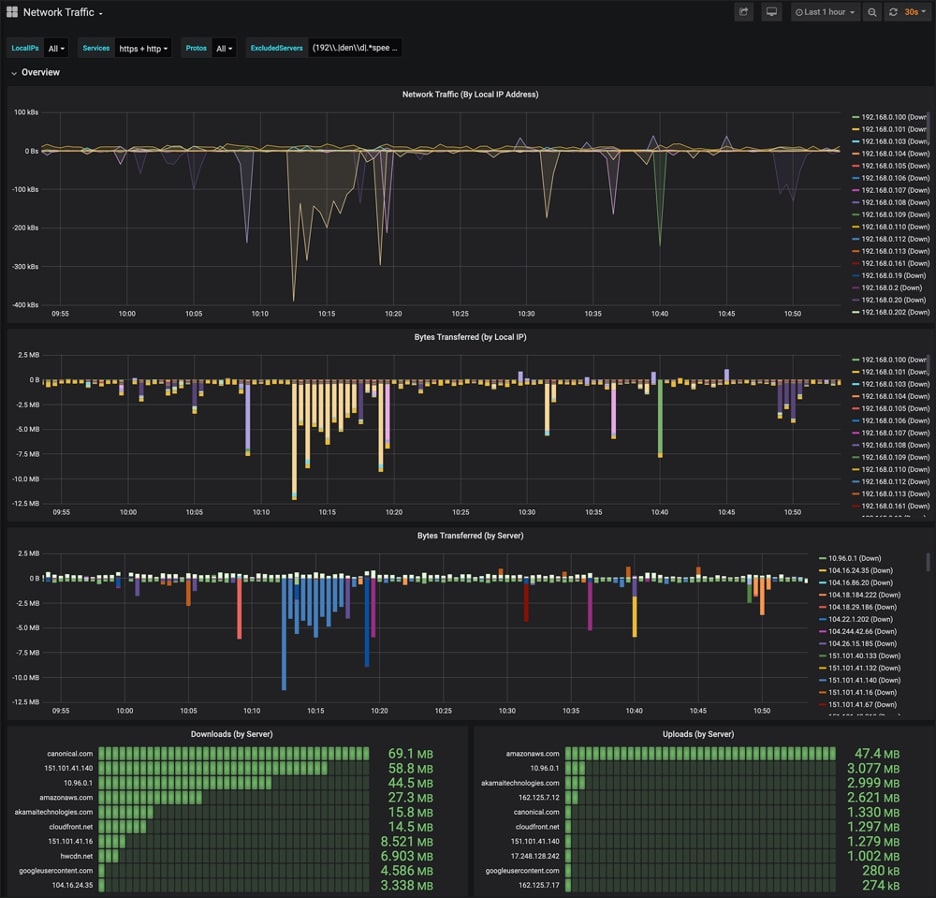
Network Monitoring Dashboard
The following Dashboard is specifically designed for Network Monitoring.
- Metrics Covered: Network Traffic, Bytes Transferred (Both by Local IP and Server)
- JSON file link: https://grafana.com/grafana/dashboards/12619
- Dependencies: Grafana (v. 6.6.2), Bar Gauge, Graph, Prometheus (1.0.0)
- Dashboard ID: 12619
- Instructions: https://www.technicallywizardry.com/raspberry-pi-network-monitor/
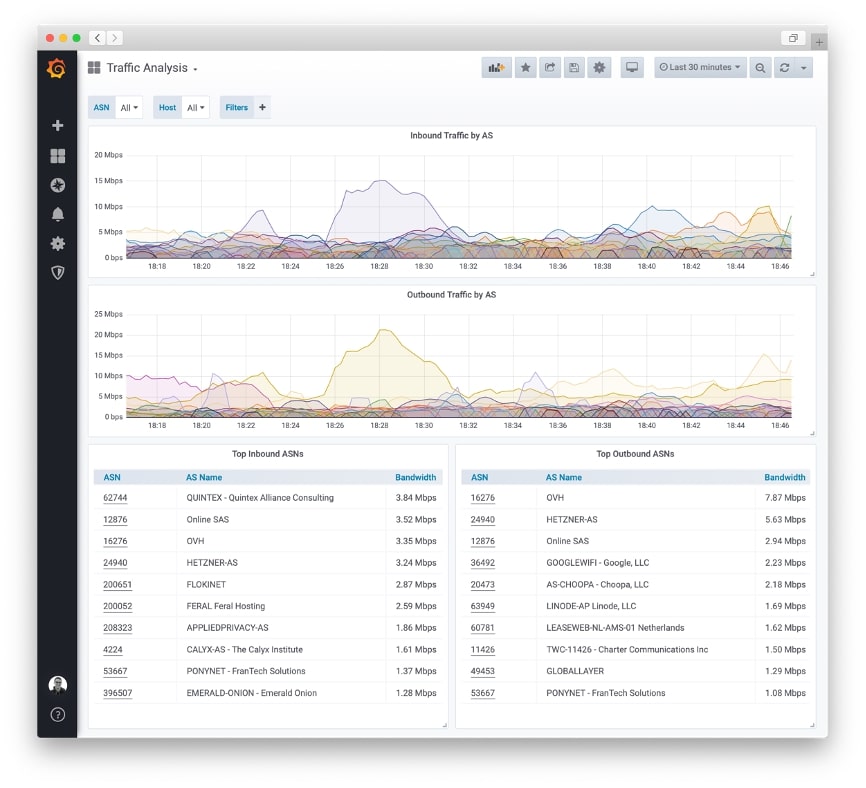
Network Traffic Flow Analysis Dashboard
The following Dashboard visualizes a series of traffic exchanges among two network devices (routers).
- Metrics Covered: Inbound and Outbound Traffic
- JSON file link: https://grafana.com/grafana/dashboards/11206
- Dependencies: Grafana (v. 6.4.3), Graph, Table, Prometheus (1.0.0)
- Dashboard ID: 11206
Note: The dependencies are only relevant when you’re trying to install Grafana manually.
MetricFire is dedicated to giving you a seamless experience so that you could focus on what you do best. Sign up for a free trial to know more and book a free demo with us.
Conclusion
In this post, we explored network monitoring in detail along with some conventional Grafana dashboards for traffic visualization. We also noticed that hosted Graphite is a better alternative to the standard Graphite as it provides additional features to the already existing open-source technology. That too at incredibly low pricing!
You should access MetricFire's hosted Graphite features either by signing up for a free trial or booking a demo and get in touch with one of our experts.


