

Table of Contents
- Introduction
- Why should I Monitor my Routers?
- Getting Started with Monitoring My Routers
- Using MetricFire for monitoring
- Sign Up for Metricfire:
- Add Your Routers:
- Select Metrics:
- Customize Alerts:
- Visualize Data:
- Real-Time Monitoring:
- Integrate with Grafana:
- Building network dashboards with Grafana
- Conclusion
Great systems are not just built. They are monitored.
MetricFire runs Graphite and Grafana as a fully managed service for growing engineering teams, taking care of storage, scaling, and version updates so your team doesn't have to. Plans start at $19/month, billed per metric namespace rather than per host, and include engineer-staffed support. Integrations work natively with Heroku, AWS, Azure, and GCP, and data is stored with 3× redundancy in SOC2- and ISO:27001-certified data centres.
Introduction
Routers are essential for connecting devices. Routers decide where the internet goes and how fast it should be. Because they play such a crucial role, it's vital to keep an eye on them and make sure they're doing their job well. This act of keeping an eye on routers is what we call "router monitoring."
Monitoring routers isn't just about checking how the routers are doing; it's about making sure the whole network works well. When you keep a close watch on your router, it can find problems before they cause trouble, make sure data moves smoothly, and give you useful information about how people use the network. Plus, with cyber threats getting smarter, monitoring helps protect your network.
Lots of tools have been made for it. Some are free, and others are for big businesses. These tools not only watch the routers all the time but also give you helpful data, send alerts if something's wrong, and show things in easy-to-understand charts. So, managing your network becomes easier and safer.
Why should I Monitor my Routers?
Routers need to be checked regularly because small issues can grow into bigger problems. Monitoring them ensures they work properly and efficiently. Here are the following reasons why we should always keep an eye on routers.
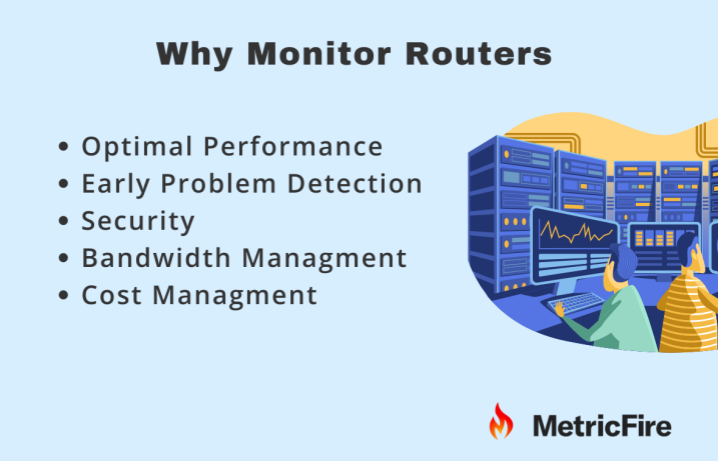
Optimal Performance:
Regular monitoring ensures that your router is functioning at its best, providing you with the fastest and most stable internet connection possible.
Early Problem Detection:
Monitoring can help identify and address it before a minor issue becomes a significant disruption. It means fewer unexpected downtimes or slow internet speeds.
Security:
Routers can be targets for cyberattacks. By keeping an eye on your routers, you can spot unusual activity that might indicate a security threat. Immediate detection allows for quick action to protect the network.
Bandwidth Management:
By monitoring, you can see which devices or applications are using the most bandwidth. It can be crucial for businesses to ensure that critical operations get the bandwidth they need or for households to manage the internet usage of various devices.
Cost Management:
For businesses, understanding data usage can help manage costs, especially if you're paying based on data usage or need to upgrade infrastructure.
In essence, monitoring your routers ensures that you get the best out of your internet connection, keeps your network secure, and helps in efficient troubleshooting and planning.
Getting Started with Monitoring My Routers
Starting with router monitoring is not as hard as it sounds. Here's a straightforward guide to help you get started:
Understand Your Network Needs:
Begin by understanding what you want to achieve with router monitoring. Are you primarily concerned about performance, security, or both? Knowing your objectives will guide your monitoring efforts.
Choose the Right Tools:
Select a router monitoring tool or software that suits your needs. Consider factors like the size of your network, your expertise, and your budget. There are many monitoring options available, ranging from free, open-source tools to commercial solutions with extensive features.
Installation and Configuration:
Choose the right monitoring tool, install it on a computer or server within your network, and connect it to your router(s) for critical insights to maximize your network's performance.
Define Key Metrics:
Decide which router metrics are most important to you. These typically include uptime, network usage or bandwidth, latency, and error rates.
Set Up Alerts:
Set up alerts in your monitoring tool. These alerts will let you know if something goes wrong. This way, you can quickly fix any issues and make sure your network stays in good shape.
Visualization and Reporting:
Take a look at the visualization capabilities and reporting options of the monitored system. Build dashboards and reports with charts and insights you care about for an easy-to-understand experience.
Continuous Monitoring:
Monitoring your tool continuously. It will collect data from your routers and provide ongoing insights into your network's performance and security.
Regular Maintenance:
Regularly review and update your monitoring configuration. Regularly maintaining your router is essential to ensure effective monitoring.
By following these steps, you can effectively monitor your router, which is essential for maintaining a stable and secure network environment.
Using MetricFire for monitoring
MetricFire is a monitoring platform that operates in the cloud and enables you to gather, visualize and analyze metrics and data from sources such as infrastructure, applications and services. By utilizing MetricFire, you can effortlessly identify problems and optimize resources. Ensure an environment for your business. It's a tool that can streamline your efforts in monitoring routers.
Here's a step-by-step guide on how to use MetricFire effectively:
Sign Up for Metricfire:
Begin by signing up for MetricFire. The platform usually offers a free trial or a basic plan to get started. Create your account and follow the process.
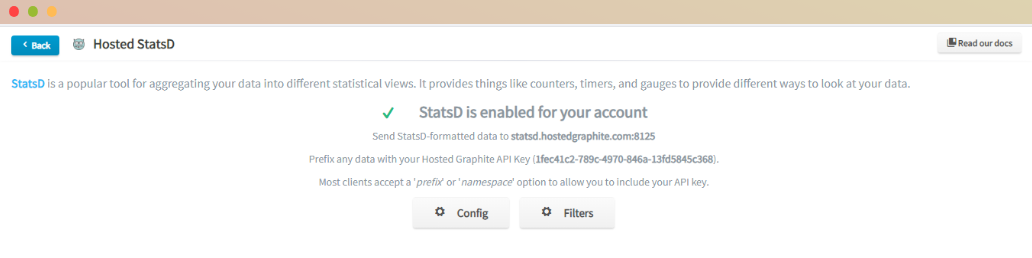
Add Your Routers:
In the MetricFire dashboard, look for an option to add data sources. Configure MetricFire to connect to your routers. You'll typically need to provide the IP addresses or hostnames of your routers and any necessary authentication details.
Select Metrics:
MetricFire allows you to choose the specific router metrics you want to monitor. Common metrics include uptime, bandwidth usage, or error rates.
Customize Alerts:
Set up alerts in MetricFire to stay informed when your metrics go beyond specific limits. Just choose your metrics, set the thresholds, and select your preferred notification method.

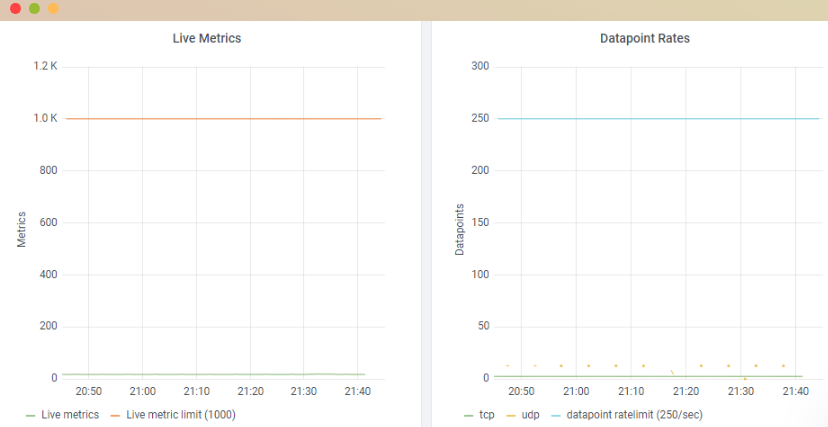
Visualize Data:
MetricFire offers a range of visualization tools that enable you to create personalized dashboards and reports. You can also easily identify trends and anomalies.
Real-Time Monitoring:
MetricFire provides real-time monitoring of your routers. You can access the latest data, enabling you to stay updated on the well-being and performance of your network.
Integrate with Grafana:
MetricFire often integrates seamlessly with Grafana, a popular visualization and monitoring tool. This integration allows you to create highly customisable and user-friendly dashboards for your router metrics.
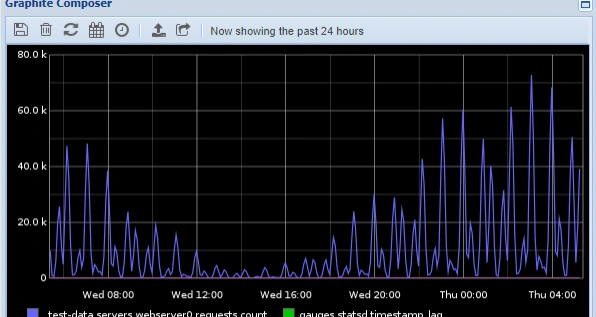
Building network dashboards with Grafana
Grafana is a strong and adaptable open-source platform for building interactive and customisable dashboards that display data from many sources, including network monitoring. Here's a step-by-step guide on how to build network dashboards with Grafana:
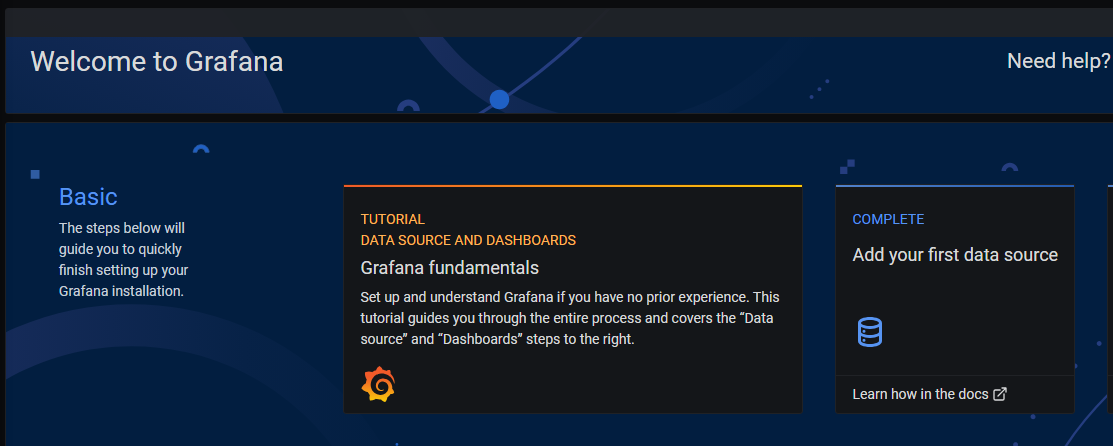
Install and Set Up Grafana:
Start by installing Grafana on a server or machine. Once installed, access the Grafana web interface through a web browser.
Add Data Sources:
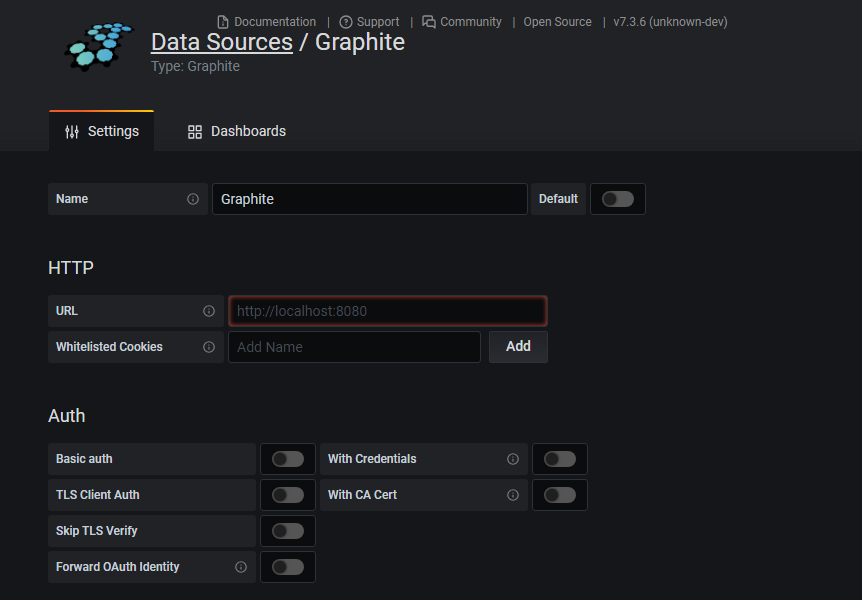
In Grafana, the first step is to add data sources. Data sources are where your router monitoring data is stored. Common data sources for router monitoring include databases, cloud services, and monitoring tools like Metricfire.
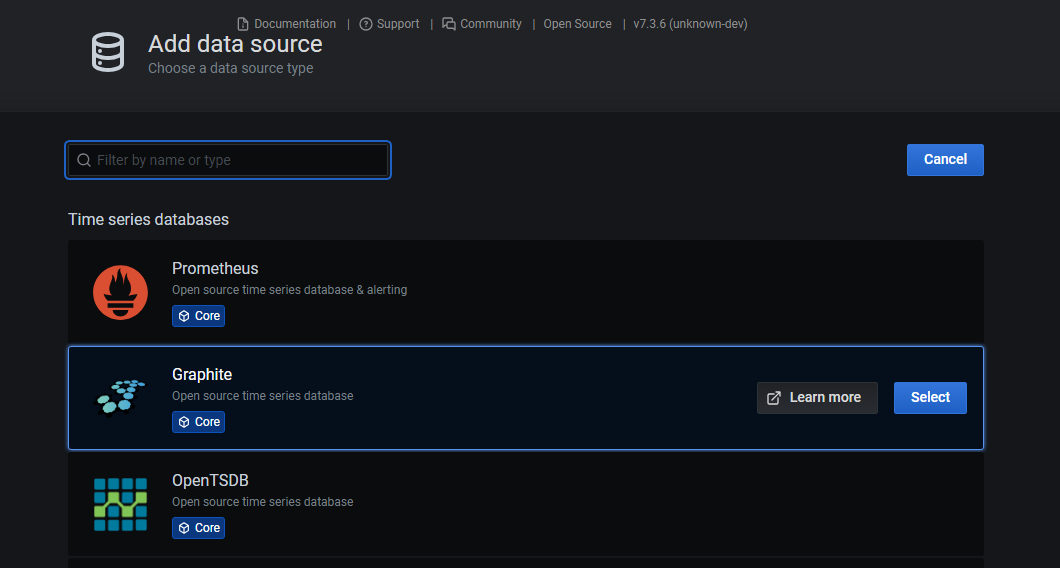
Choose your data source type and provide the necessary connection details. Test the connection to ensure it's working correctly.
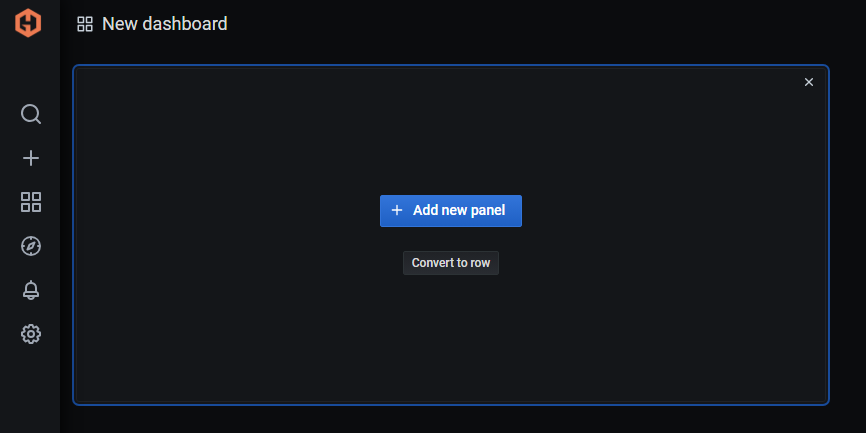
Create a New Dashboard:
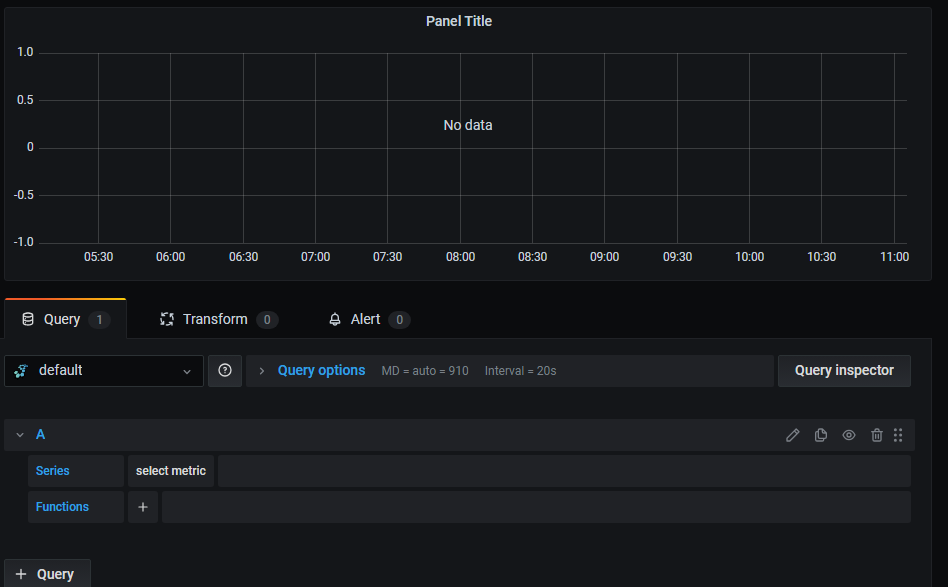
After adding a data source, go back to the Grafana home page and click on the "Create your first Dashboard."

Choose the "Add new panel" option to create your first visualisation
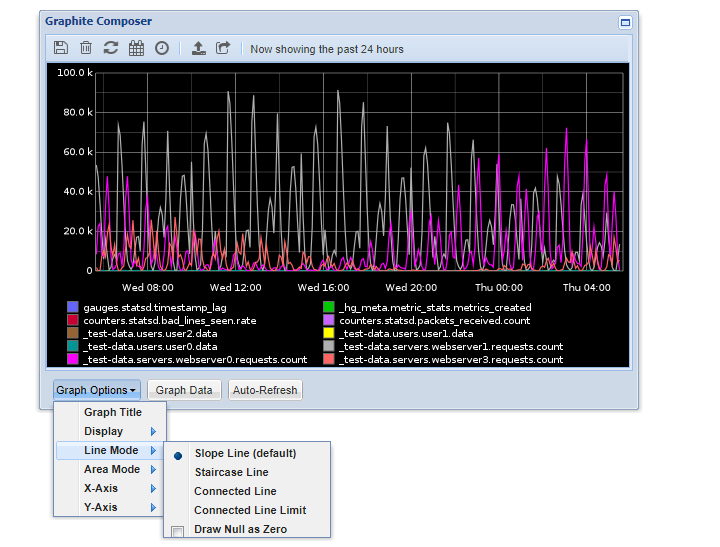
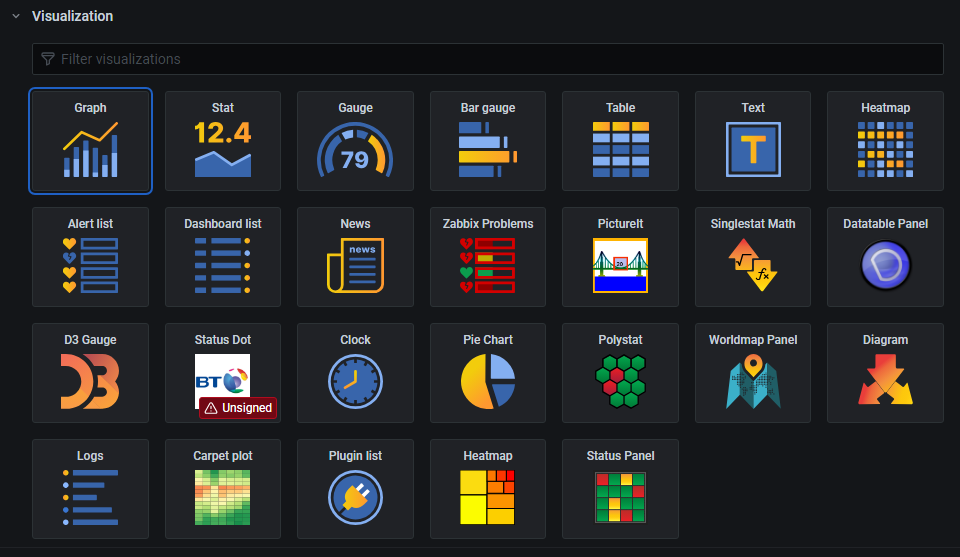
Configure Panels:
Grafana supports various panel types, including graphs, tables, single stats, and more. Select the panel type that best suits your router monitoring data.In the panel settings, specify the query to retrieve the router metrics you want to display.
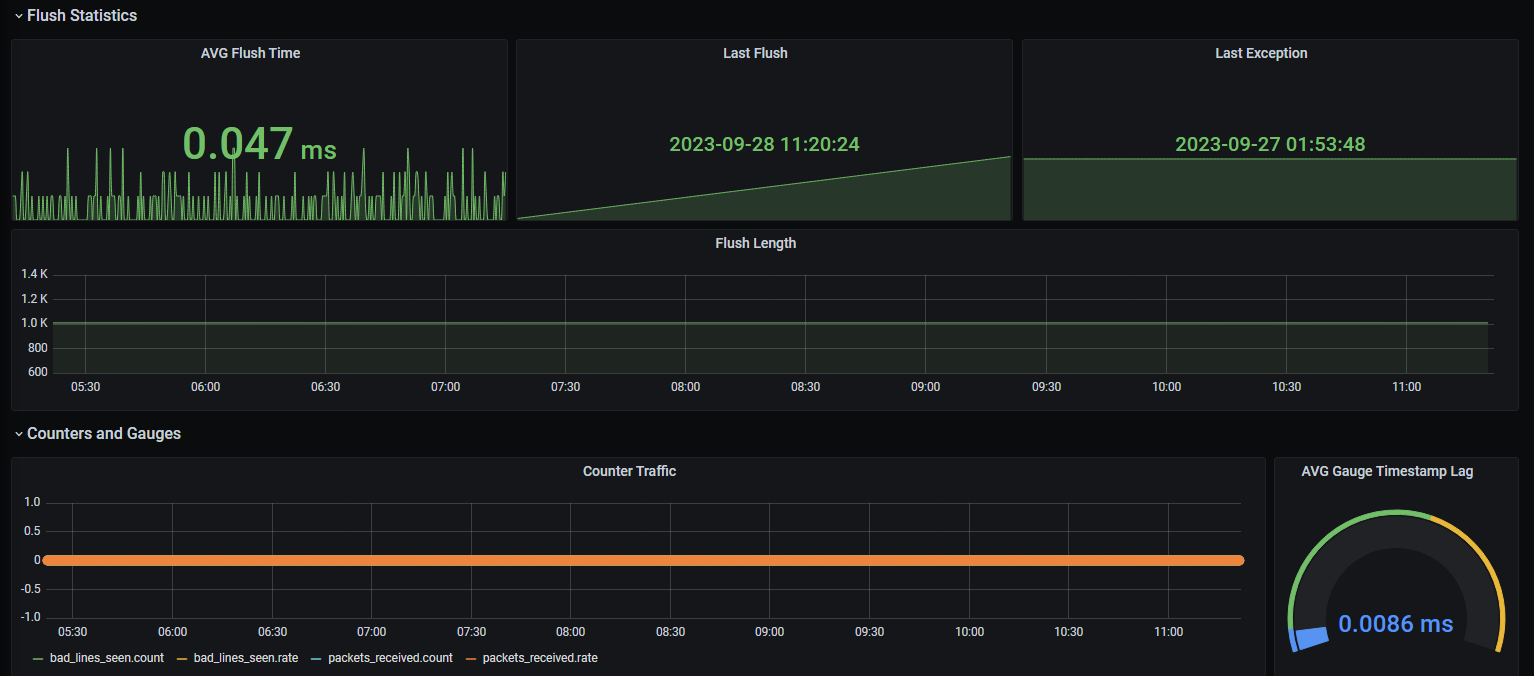
Customize Visualization:
Grafana offers extensive customisation options. You can configure colors, labels, axes, and thresholds to make your visualization informative and visually appealing.
You can also set up alerting rules specific to each panel to receive notifications when metrics exceed predefined thresholds.
Organize the Dashboard:
Make a logical configuration with the panels on your dashboard canvas. You can organize panels into topical groups, utilize rows and columns for organization, and use text panels to give instructions or further information.
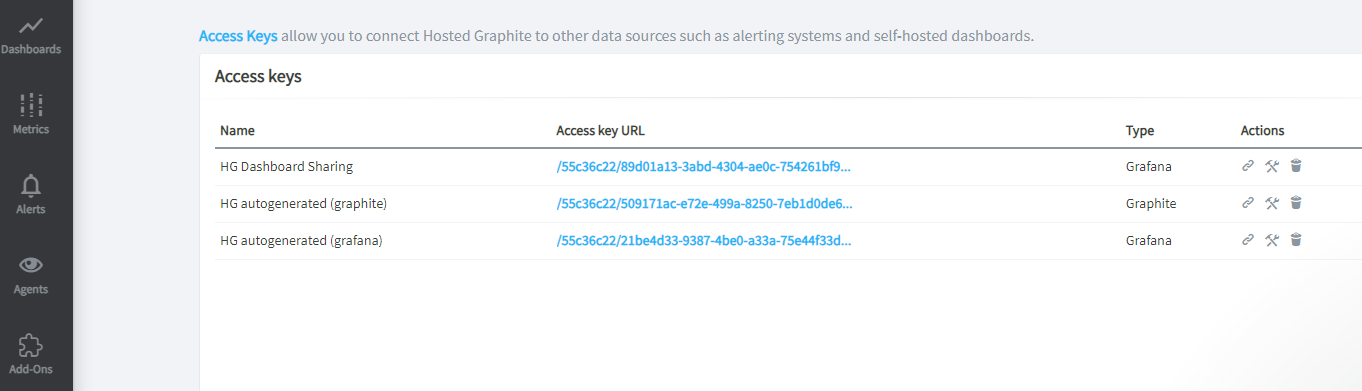
Save and Share:
Once your network dashboard is complete, give it a meaningful name and click "Save".
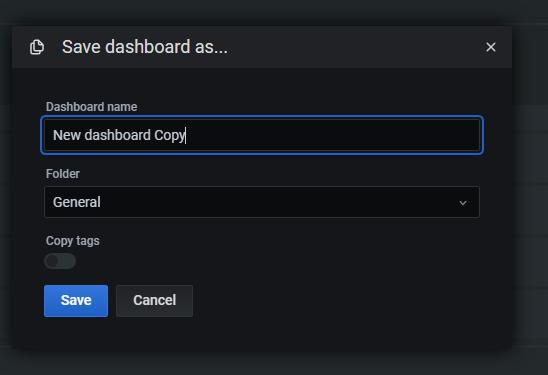
Grafana allows you to share dashboards with others by generating shareable links or embedding them in web pages.

Continuous Monitoring:
Grafana dashboards update in real time as new data arrives from your router monitoring source. You can monitor network performance and status continuously.
Explore Additional Features:
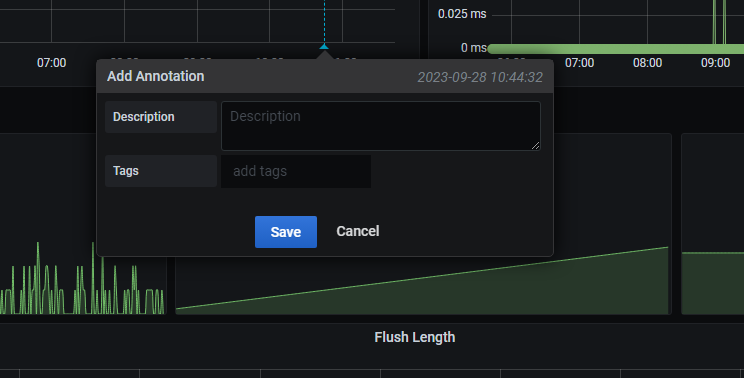
Grafana offers many advanced features, such as templating for dynamic dashboards, annotations for adding contextual information, and time range controls for historical analysis.
With Grafana, you can create visually appealing and highly informative network dashboards that provide real-time insights into router performance and other network metrics. It's a valuable tool for network administrators and IT teams looking to maintain a clear overview of their network's health and performance.
Conclusion
Monitoring routers is critical in the modern world. When issues are found, it makes sure that our network operates as efficiently as possible. Our security is still strong. Understanding what our routers are doing is essential, given the complexity of networks and the ongoing danger of cyberattacks that we face. This is where resources like MetricFire and Grafana come in; they are now useful tools. They offer customisable dashboards, alarm systems, and real-time insights.
By integrating these platforms into our network infrastructure, we gain visibility into the health of our network and become proactive in addressing issues. In essence, router monitoring with visualization tools acts as the foundation for a secure and efficient network environment. Embracing these technologies is vital for both businesses and individuals alike to navigate the landscape with confidence.

