
Table of Contents
Introduction
While cloud is seen as the go-to environment for modernizing IT strategies, many security-conscious businesses are still hesitant to adopt a full cloud strategy. A logical middle ground has now emerged: the hybrid cloud.
Hybrid cloud promotes the coupling of on-premises infrastructures with one or more public cloud services to meet both cost optimization and security compliance.
- Security compliance: Hybrid cloud computing enables an enterprise to deploy an on-premises private cloud to host sensitive or critical workloads, and use a third-party public cloud provider to host less-critical resources.
- Cost optimization: A hybrid cloud strategy provides businesses with greater flexibility by moving workloads between cloud solutions as needs and costs fluctuate.
Despite its benefits, hybrid cloud computing can present technical and management challenges. These challenges include:
- Network connectivity and security concerns: Workloads running on-premises must access and interact with public cloud providers, which requires solid network connectivity and secure mechanisms to provide trusted channels for data communication.
- Technical skills: Another challenge with hybrid cloud computing is the construction and maintenance of the private cloud itself, which requires substantial expertise from local IT staff. The latter are fully responsible for the technical support of their private cloud, and must accommodate any changes to public cloud APIs and service changes over time.
- Monitoring: Any modern IT environment requires an efficient monitoring strategy to consistently operate its different components (infrastructure and applications). This is, in particular, the importance of having a unified management pane to operate services relating to workloads on-premises and on public clouds.
This article discusses the monitoring aspects, with a focus on how to set up end-to-end monitoring along with a unified management pane.
A monitoring architecture for hybrid cloud
We will start by describing a technical architecture to monitor a hybrid cloud environment. You may note that this is architecture is opinionated, and our choice of implementation is driven by (without being limited to) the use of open-source tools or their derivatives. After which, we will then discuss a unified application monitoring approach.
In the architecture depicted in Figure 1, we consider an organization with an initial on-premises IT infrastructure and a part of workloads deployed on the cloud for high availability and disaster recovery.
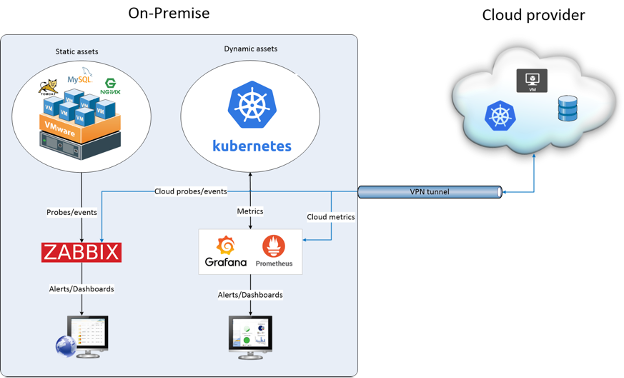
Figure 1: An architecture for monitoring hybrid cloud on-premises.
Environment on-premises
We imagine a typical IT environment held by a virtual infrastructure environment, atop of which virtual machines are created to host both traditional application and microservices stacks. In such an environment, we can achieve comprehensive monitoring based on the following stacks:
- A probe-based monitoring solution, based on tools like Zabbix or Nagios, is used to handle the monitoring of static components (physical machines, virtual machines, applications processes, service endpoints, ...). For more insight into Zabbix, have a look through our Zabbix Review article.
- An observability stack, based on Prometheus + Grafana for instance, is introduced to track metrics related to computing resources and application components, including microservices components. For more information about MetricFire’s Hosted Prometheus and Hosted Grafana, you can book a demo with one of our experts.
- As the traditional probe-based monitoring and observability tools lack support for monitoring volatile microservice components (e.g. pods), we introduce a third level of monitoring as discussed here to deal with the monitoring of such components.
Environment on cloud
On the cloud, the virtual infrastructure is handled by a public cloud provider (e.g. Amazon AWS, Google GCP, or Microsoft Azure). No matter the selected cloud provider, our vision is that the organization relies on managed resources as much as possible.
We consider a cloud environment composed of:
(i) cloud virtual instances (e.g. EC2 instances on AWS, GCE instances on GCP, virtual machines on Azure, …) to traditional applications’ components; and
(ii) managed Kubernetes instances (e.g. EKS on AWS, GKE on GCP, AKS on Azure, …) to host microservices.
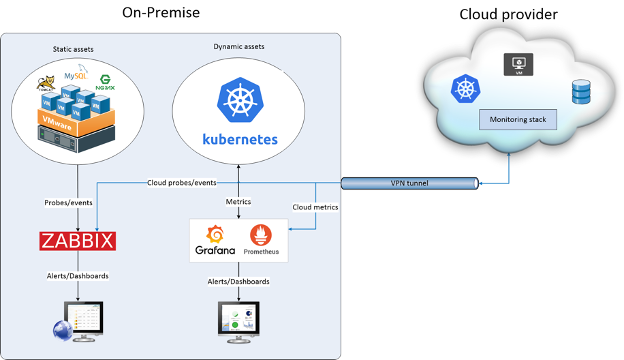
Figure 2: Architecture for monitoring hybrid cloud on-premises and/or on cloud
The proposed monitoring approach is addressed in two strategies that can be considered alternative or complementary:
- A first strategy, sketched in Figure 1, relies on the monitoring environment on-premises and takes advantage of the VPN infrastructure to gather probes and monitoring from the cloud infrastructure. On the cloud we can also gather metrics and probes natively enabled by the cloud environment. But in this strategy, a disaster in the on-premises environment would cause the monitoring of the cloud environment un-usable.
- A second strategy is to have an alternative (or completerary) monitoring stack on the cloud, with a stack as discussed above but a little particularity. The monitoring tools can be deployed from hosted services such as Metricfire for a hosted Prometheus + Grafana.
Unified application monitoring
The different architectures discussed above provide a global framework to track metrics and incidents, as well as on-premises and cloud environments. However, these architectures suffer from a weakness commonly encountered in many enterprise environments.
Indeed, having a traditional probe-based monitoring stack separated from the monitoring of microservices may lead to a non-uniform way of monitoring applications in production.
To complement these architectures and make them effective for operations monitoring, we propose to integrate a unified visualization that leverages probes from both the traditional monitoring stack and the microservice monitoring stack.
Sketched in Figure 3, this unified monitoring can be designed atop of tools like RealOpInsight which enables the mechanism to gather probe status from heterogeneous monitoring tools, including probes from systems like Zabbix and Nagios than probes natively backed by Kubernetes.
In addition, this mechanism should enable to set up and handle relationship and dependency mapping for monitored applications. With these core features, we want to enable a unified and comprehensive visualization to help monitor and operate the hybrid cloud environment in a central place.

Figure 3: Architecture for monitoring hybrid cloud with an unified applications’ availability visualization dashboards.
Define and track SLA/SLOs targets
Another aspect we want to consider is the ability to define and track Service Level Agreements (SLA) and/or Service Level Objectives (SLO) targets. This means that we want the monitoring stack to provide mechanisms to measure how applications are operating in production.
SLA/SLO tracking is an essential part of any cloud infrastructure. To help to track that, our approach is to define SLA/SLO targets for an application based on its availability for a given time period.
For example, considering a period of 7 days with five-minute application availability checks (i.e. 1440 checks total), if the application was not available during 2 checks, then the availability during that period can be computed as follows: (1440 — 2)/1444 = 99.9986%.
With this foundation, the unified application monitoring framework as discussed above should implement mechanisms to collect and track such SLA/SLO targets.
Monitoring challenges for a hybrid-cloud
Here are challenges to address when monitoring hybrid clouds.
- Components are spread geographically on-premises and on cloud: The connectivity between the on-premises and the public environments typically relies on a Virtual Private Network (VPN) infrastructure to ensure data transit between the environment in a safe way. The monitoring shall thus take into account, the components on-premises, the components on cloud, as well as the VPN infrastructure itself. Regarding its criticality in such an environment, the monitoring of the VPN is crucial and may be needed to be achieved with different perspectives (e.g. on premises and on the public cloud).
- Monitor durable and volatile components: In a traditional IT environment on-premises, the components to monitor are typically durable (e.g. the number of Apache processes on a machine). The monitoring of such components has been broadly addressed during the last two decades with tools like Nagios and Zabbix. However, in modern IT environments raised from the adoption of public clouds, components may not be durable. For instance, a serverless instance has a short lifetime by design. The same way a pod in a Kubernetes cluster is immutable and replaceable at any time. Such volatile components need to be monitored with an original approach. Observability tools, like Prometheus, help to track the behavior of such volatile components over time but do not suit to handle operations monitoring (e.g. how to detect and highlight a deployment in CrashBackupOff).
- Monitor the availability of services provided to end-users: An essential aspect of monitoring is to anticipate and, if possible, to quickly detect outages on services provided to end-users. We call this service availability monitoring, and that also goes beyond what can be achieved with an observability approach. While this aspect is also relevant for non-hybrid clouds, it requires setting up a suitable monitoring framework to address the particularity of hybrid cloud components as discussed above.
- Monitoring SLO/SLA targets: Service Level Objectives (SLO) and Service Level Agreement (SLA) are key indicators that help to assess if services reach pre-defined availability targets for a given period of time. Therefore, along with the ability to monitor the availability of end-user services, it’s also essential to be able to track and measure this availability over time. This means that our monitoring framework should provide mechanisms to define and track targets for SLO and SLA.
Conclusion
The hybrid cloud computing model is a great approach for enterprises willing to modernize their IT, as this provides a good balance between security and cost optimization. Despite its benefits, hybrid cloud poses several implementation challenges.
One of these challenges is the monitoring, in particular the ability to consistently monitor assets from both the on-premises and the cloud infrastructure. To monitor your hybrid cloud environment, MetricFire offers its Hosted Prometheus and Hosted Grafana to gain in-depth insight.
You can use our product with minimal configuration into your environments. If you would like to learn more about it please book a demo with us to speak with one of our experts, or sign up for the free trial today.


