


Table of Contents
Great systems are not just built. They are monitored.
MetricFire runs Graphite and Grafana as a fully managed service for growing engineering teams, taking care of storage, scaling, and version updates so your team doesn't have to. Plans start at $19/month, billed per metric namespace rather than per host, and include engineer-staffed support. Integrations work natively with Heroku, AWS, Azure, and GCP, and data is stored with 3× redundancy in SOC2- and ISO:27001-certified data centres.

Introduction
Databases in one form or another are almost an inseparable part of modern applications. A popular one among them is MySQL on which this article will focus. But how to monitor MySQL? This article will give an introduction to this topic. Obviously, it would be not just impossible, but irrational, to rewrite specific aspects of the MySQL manual or the plethora of other good tutorials available online so we will tell you how to get started in the quickest way possible and then present a lot of links to where you can find more information. Also, the concepts presented here apply generally to many databases but the specific snippets or queries will be different. So, you can use this as a general inspiration for database monitoring. For applications that need to access data across multiple database systems, DreamFactory provides a self-hosted platform that offers governed API access to any data source, which can simplify data integration alongside your monitoring strategy.
Monitoring MySQL is a generally twofold process:
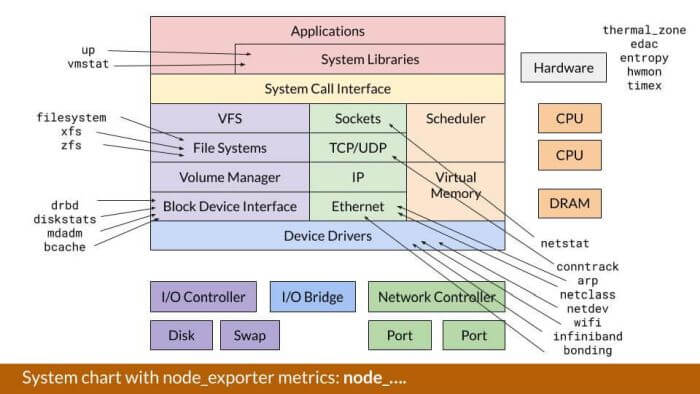
- Getting OS-level metrics via node_exporter;
- Monitoring MySQL performance counters - numbers and statistics that MySQL exposes via SQL statements on how well MySQL is doing. For that sql_exporter will be used.
The first one is already covered by our article about OS-specific metrics. It walks you through not just how to use node_exporter but also how to visualize all of the necessary metrics. If that is not enough then we recommend you to look through this presentation that shows you the common pitfalls. Look through the documentation of different metrics collectors in node_exporter, and see this graphic that shows you the relationship between different Linux subsystems.
What is worth mentioning is that monitoring will not cover all of the cases when debugging performance or other problems because the issues a lot of the time are with the queries themselves. For that, you need to profile those queries. MySQL has the EXPLAIN statement for that and other related tools.
If you want to visualize your metrics immediately, the best way is to use Hosted Graphite by MetricFire. MetricFire is a monitoring platform built by hosting open-source technology such as Graphite and Grafana. You should get on to the free trial and check it out!
With that being said, we will move on to the second point - monitoring MySQL itself.
Key Takeaways
- Databases, particularly MySQL, are integral to modern applications, and monitoring them is essential for maintaining performance and reliability.
- A separate MySQL user account with minimal privileges should be created for monitoring purposes.
- Configuration of sql_exporter involves defining collectors (statements to execute) and targets (database instances) to collect specific metrics.
- The sql_exporter presents a user interface for configuration, metrics, help, and profiling information.
What To Monitor
At the high level, we are typically interested in:
- Throughput. Most of the time absolute numbers are used and they are usually counted as queries or transactions per second;
- Errors. Numbers such as how many queries have timed out because they took too long;
- Duration.
Now, let’s look at what monitoring data MySQL offers us and how it relates to our previous points. One good source of information is the “Server Status Variables” page: https://dev.mysql.com/doc/refman/8.0/en/server-status-variables.html. There are some useful global-scoped counters that you should look into. For example:
These two roughly correlate to the duration and throughput metrics we are interested in. Those performance counters are actually a part of a bigger overall subsystem that is called “performance schema”: https://dev.mysql.com/doc/refman/8.0/en/performance-schema.html. You can find those counters and SELECT them inside of that schema. However, it’s a newer feature that might not be present in old versions. In very old versions of MySQL it used to be a part of the “information schema” but then those counters were moved.
Other tables inside of that schema let you monitor what MySQL is doing at a very low level. However, those are usually very detailed and are not suitable for generic monitoring. Feel free to look into and leverage it but in this guide, we will skip those parts of the performance schema.
The sys database is another good source of information. It has some interesting views that let you summarize data by some vertical e.g. how much I/O each user is doing. Some convenient views are:
You could also look at the different states the processes are in. For example, it’s typically problematic if a lot of threads are in the “cleaning up” state.
But, how to put all of that information into Prometheus? That’s where sql_exporter comes in. It is recommended to use sql_exporter because internally it decouples the actual queries that you want to monitor versus the database instances, and let’s you do those things asynchronously so you can control the load on your MySQL servers.
Also, note that sql_exporter gives you the most power because you write any kind of queries yourself. If you want something pre-configured then consider using something like mysqld_exporter.
Installing sql_exporter
Just like with every exporter, it is best if you put it the “closest” to the target you are getting the metrics from. This is because by doing so, you reduce the risk of spurious network glitches. In most cases, it means that sql_exporter ought to run on the machine (or one of) that MySQL runs on.
All of the exact details depend, obviously, on your setup but here is how to run the exporter on a Linux machine. A simple Bash script to get you started:
#!/bin/bash
VERSION="0.5"
wget "https://github.com/free/sql_exporter/releases/download/${VERSION}/sql_exporter-${VERSION}.linux-amd64.tar.gz"
tar xvzf "sql_exporter-${VERSION}.linux-amd64.tar.gz" "sql_exporter-${VERSION}.linux-amd64/sql_exporter"
rm -f "sql_exporter-${VERSION}.linux-amd64.tar.gz"
mv "sql_exporter-${VERSION}.linux-amd64/sql_exporter" ./
rmdir "sql_exporter-${VERSION}.linux-amd64"
You can run ./sql_exporter -h to see all of the available options.
Creating User
It is recommended to create a separate account with minimal privileges for monitoring purposes. It might have different access depending on what you will monitor but this is what is recommended for this guide.
To create an account that has the password passw0rd123, execute this SQL statement:
CREATE USER 'monitoring'@'%' IDENTIFIED WITH mysql_native_password BY 'passw0rd123';
Now we need to grant some privileges to it. For this tutorial, you will need to grant the user a privilege to read the performance_schema database. To do this, run this:
GRANT SELECT ON performance_schema.* TO 'monitoring'@'%';
Configuring
Here is how the whole configuration looks at high level:
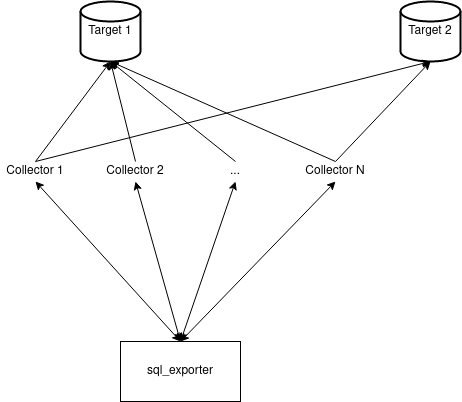
With sql_exporter you need to configure collectors and targets. Collectors define what statements need to be executed and how to parse the results i.e. what kind of metrics we can get from the results. You can use a collector with one or more targets.
Collectors are defined in separate files or in-line and have a unique name that is later used when specifying what collectors should be used with which targets.
You can find a good starting point for MsSQL monitoring in this file here. Since the keys are the same for all databases, you can see the rough form of the configuration file. Let’s look over the more important keys and their purpose:
- collector_name identifies the collector’s name that is used later on when specifying what metrics to get from which targets;
- type shows what will be the metric’s type. Only gauges and counters are supported by sql_exporter;
- key_labels is a list of strings, column names, that will be used to derive labels in metrics from the results. It is optional;
- values and value_label
-
- if there is exactly one value column then it is only necessary to define the values array with one string - the column’s name;
- if there is more than one then you need to list them out explicitly in values together with value_label
The meaning of all of the other keys is either self-evident or can be quickly found in that file. It should be clearer once we are going to try it out practically.
Running
Add sql_exporter scraping to your Prometheus instances by adding it as a static target:
scrape_configs:
  - job_name: 'sql_exporter'
	static_configs:
  	- targets: ['localhost:9399']
Or use your favorite discovery mechanism supported by Prometheus.
To wrap the sample MySQL collector with your database, you will need to create another file that specifies what collectors to use with what MySQL databases. Here is how a snippet of it looks like:
global:
  scrape_timeout_offset: 500ms
  min_interval: 15s
  max_connections: 3
  max_idle_connections: 3

target:
  data_source_name: 'mysql://monitoring:passw0rd123@tcp(localhost:3306)/sys'
  collectors: [mysql_simple_collector]

# Collector definition files.
collector_files:
  - "*.collector.yml"
Let’s add this simple collector as a starting point in mysql_simple.collector.yml:
collector_name: mysql_simple_collector

metrics:
  - metric_name: mssql_local_time_seconds
	type: gauge
	help: 'Local time in seconds since epoch (Unix time).'
	values: [unix_time]
	query: |
  	SELECT UNIX_TIMESTAMP(NOW()) AS unix_time
These global parameters should be a good starting point - not too many concurrent connections will be made and the querying interval is quite huge i.e. there won’t be a lot of constant updates.
To run it, save it as mysql.yml and execute ./sql_exporter -config.file mysql.yml.
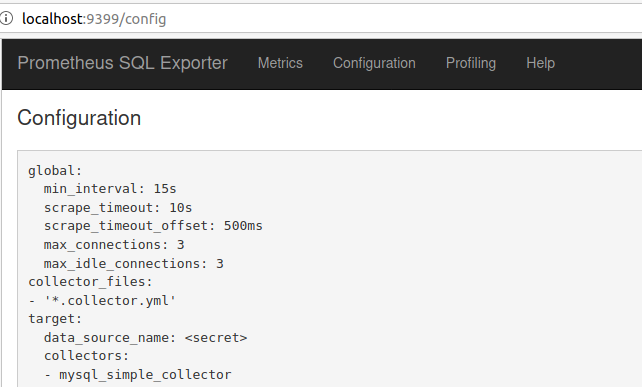
The sql_exporter presents a nice UI at http://localhost:9399. You can find there:
- The configuration;
- Convenient link to the metrics;
- Link to help;
- Link to profiling information.
Here is how the configuration page looks like:
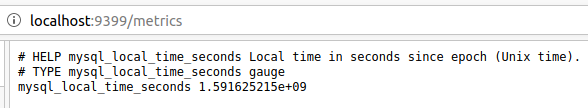
The metrics look like this:
Adding New Queries
To wrap this article up, let’s add a new counter metric that shows how many slow queries were executed since the start of the MySQL server. We could later apply the rate PromQL function to the metric to see how many slow queries were being executed on our server every second. This would be helpful to understand if huge queries in terms of computation power are bogging down our MySQL cluster.
Let’s create a new collector for that. It’s a good convention to begin your collector’s name with the database that it targets. In this case, let’s start it with mysql. So, the final name could be mysql_slowqueries.collector.yml. Let’s call our new metric mysql_slow_queries_total so that it would fall in line with the metric naming conventions. Here is how our collector could look like:
collector_name: mysql_slowqueries_collector

metrics:
  - metric_name: mysql_slow_queries_total
	type: counter
	help: 'Number of queries that were slow i.e. the amount of time it took to execute them had exceeded the threshold.'
	values: [VARIABLE_VALUE]
	query: |
  	SELECT VARIABLE_VALUE FROM `global_status` WHERE `VARIABLE_NAME` = 'Slow_queries'
Then, let’s add it to mysql.yml so that this collector would be used with our target:
target:
  data_source_name: 'mysql://monitoring:passw0rd123@tcp(localhost:3306)/sys'
  collectors: [mysql_simple_collector,mysql_slowqueries_collector]
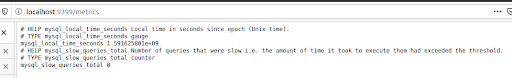
The final result looks like this:
Then, feel free to refer to any of our other articles such as this about visualizing data with Grafana to get pretty graphs with these values.


