
Table of Contents
Great systems are not just built. They are monitored.
MetricFire is the fully managed Graphite and Grafana platform for small teams that don’t want to self-host their monitoring stack. Pre-built dashboards, alerts, and native add-ons for Heroku, AWS, Azure, and GCP. All with dedicated support and no infrastructure to maintain.
What is Prometheus?
Prometheus is a very popular open-source monitoring and alerting toolkit originally built in 2012. Its main focus is to provide valid insight into system performance by providing a way for certain variables of that system to be monitored. Prometheus displays the performance of these variables as a graph to allow its users to see their system’s performance at a glance. It also allows them to switch between multiple time series variables so users can see how their system performs from different perspectives.
This information is provided to the users in the form of graphs on the Prometheus dashboard, with the possibility of opening multiple graphs at a time for different system metrics so the user can easily compare system performance from different angles. As a result of its power and adaptability, many organizations and companies have adopted Prometheus, and the project has a very active developer and user community. It is now a standalone open-source project, maintained independently of any company. As of 2016, Prometheus joined the Cloud Native Computing Foundation as its second hosted project, after Kubernetes.
If you are just starting out with Prometheus, take a look at our other posts that go in-depth on Prometheus’ architecture, such as Prometheus monitoring 101, First contact with Prometheus exporters, and Prometheus remote storage. You can also sign up for a free trial with MetricFire, and start using Graphite and Grafana today. The free trial is a great chance to apply what you learn in this article and get some real context for how it looks.
Key Takeaways
- Prometheus is an open-source monitoring and alerting toolkit created in 2012, designed to provide insights into system performance by monitoring specific variables. It displays performance metrics as graphs, allowing users to assess their system's health and performance from various angles.
- Prometheus offers a dashboard that displays graphs of system metrics, enabling users to monitor their data efficiently. Users can open multiple graphs simultaneously to compare different system metrics.
- Prometheus has gained popularity due to its power and adaptability, with many organizations and companies adopting it. It is now an independent open-source project with an active developer and user community.
- This tool allows users to efficiently visualize time series metrics collected by Prometheus. Users can specify which metrics to display, making it easier to focus on essential data.
- Grafana is an open-source metric analytics and visualization suite often used to visualize time series data. It can be integrated with Prometheus as a data source for creating sophisticated dashboards.
Prometheus Dashboard Options
At a high level, Prometheus can be said to have two main parts: a powerful backend server meant to scrape and store time series data metrics, and a web console or dashboard for visual representations. When it comes to dashboards or visualizations with Prometheus, there are three options: Prometheus Expression Browser, Grafana, and Prometheus Console Templates. The first two are the most useful, while Prometheus Console Templates have some significant applications for more advanced situations.
Grafana and the Prometheus Expression Browser come packaged in the initial download. Expression Browser is used for quick queries and flexible investigations into the data, while Grafana is used to visualize and monitor very significant metrics over a long period of time. This article will go into depth about each of these visualization tools below.
Prometheus Expression Browser
The Prometheus Expression Browser provides an efficient way for you to display time series metrics collected by the Prometheus server. It is part of the Prometheus suite and can be accessed using the endpoint /graph. Using this tool, you can efficiently visualize time series metrics by either displaying them on a graph or in a tabular manner depending on your preferences.
Given the sheer amount of data collected by Prometheus, it can be confusing to know what metrics you should keep an eye on, with some people trying to represent every piece of data they have, cramping up the console. The Expression Browser allows you to specify which exact metric you wish to display by typing in the metric name into the Expression field.
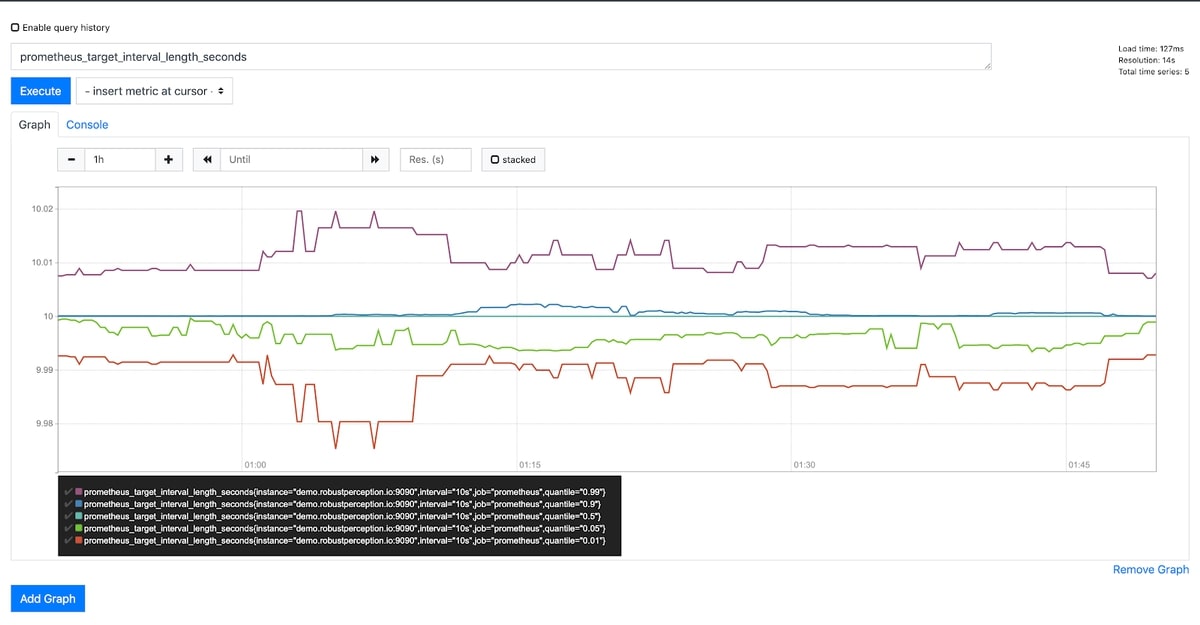
When you hit the Execute button, data relating to this particular metric, provided it exists, is shown both in a table (on the Console Tab) and a graph (on the Graph Tab), allowing you to switch between these two with just a single click. For example, say we want to pull up data on the prometheus_target_interval_length_seconds metric. This metric measures the amount of time between target scrapes. In other words, the amount of time between data collection from a Prometheus target. Entering this metric into the Expression Browser yields the following results:
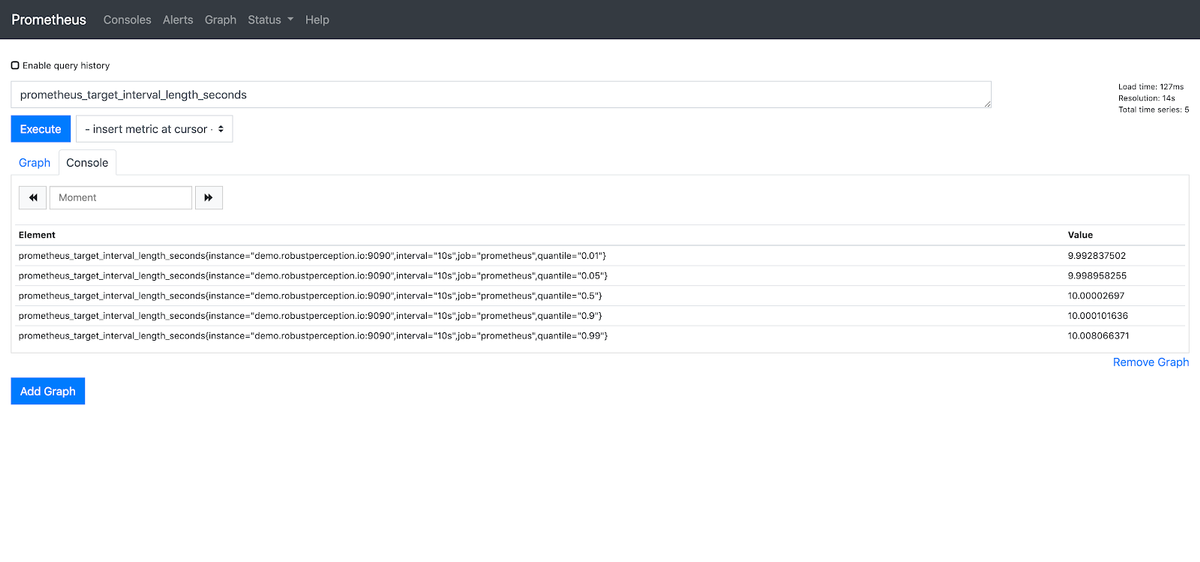
You can visit the /metrics endpoint to get a list of all the time series metrics being monitored by Prometheus. You could have multiple graphs open on the Expression Browser at a time, but it’s best practice to keep it at a bare minimum, only monitoring data that is essential to accomplish your goal. Flooding the page with irrelevant graphs/lines on a graph can cause you to lose focus on what is important.
For more information on how to handle the Prometheus Expression Browser, visit our article Getting Started With PromQL. We outline the most important information about how to use Expression Browser there.
Grafana
Grafana is an open-source metric analytics and visualization suite. It is most commonly used for visualizing time series data for infrastructure and application analytics, although many other use cases include monitoring industrial sensors, home automation, weather, and process control. It ships with support for Prometheus as a data source, so integrating Grafana into Prometheus is a breeze. For more information on Grafana, check out our articles Getting Started With Grafana, and Grafana Dashboards.
In order to use Grafana as the visualization dashboard for your data metrics collected by Prometheus, first you have to install Grafana. Since that is beyond the scope of this post, here is a link to the official Grafana installation instructions. Once you have Grafana up and running, it will be listening on http://localhost:3000, with the default login of "admin" / "admin". It goes without saying that it is imperative that you change this default login credentials as soon as you login the first time.
Now we have to configure Grafana so that it uses Prometheus as a datasource. In order to achieve that goal, follow these steps:
- Click the Grafana icon in the top header to open the side menu.
- In the side menu, below the Dashboards link, you should find a link named Data Sources.
- Click the + Add data source button in the top header to add a new data source.
- Select Prometheus from the Type drop-down list.
Note: If you can’t see the Data Sources link in your side menu, it means your current user does not have the Admin role for the current organization.
- Enter an appropriate name in the Name field. This field represents the data source name. This is how you refer to the data source in panels & queries.
- Under the HTTP settings, set the appropriate Prometheus server URL (for example, http://localhost:9090/).
- Adjust other data source settings as desired (Proxy = access via Grafana backend, Direct = access directly from browser).
- Click "Add" to save the new data source.
For more info on these data source options and other temporal options, check out the official grafana documentation.
The following image shows an example data source configuration:

Now that we have set up Prometheus as our data source, we can now begin graphing some metrics. To create a graph in Grafana, follow these steps:
- Click an existing graph title, then click "Edit".
- Under the "Metrics" tab, select your Prometheus data source (should be on the bottom right).
- Enter any valid Prometheus expression into the "Query" field, while using the "Metric" field to look up metrics via autocompletion. Also, remember you can view all metrics gathered and stored by Prometheus on the /metrics endpoint.
- To format the legend names of the time series, use the "Legend format" input. For example, in order to show only the method and status labels of a returned query result, separated by a dash, you could use the legend format string {{method}} - {{status}}.
- Tune the other graph settings to meet your requirements until you have a working graph.
The following is an example of a Prometheus graph configuration:
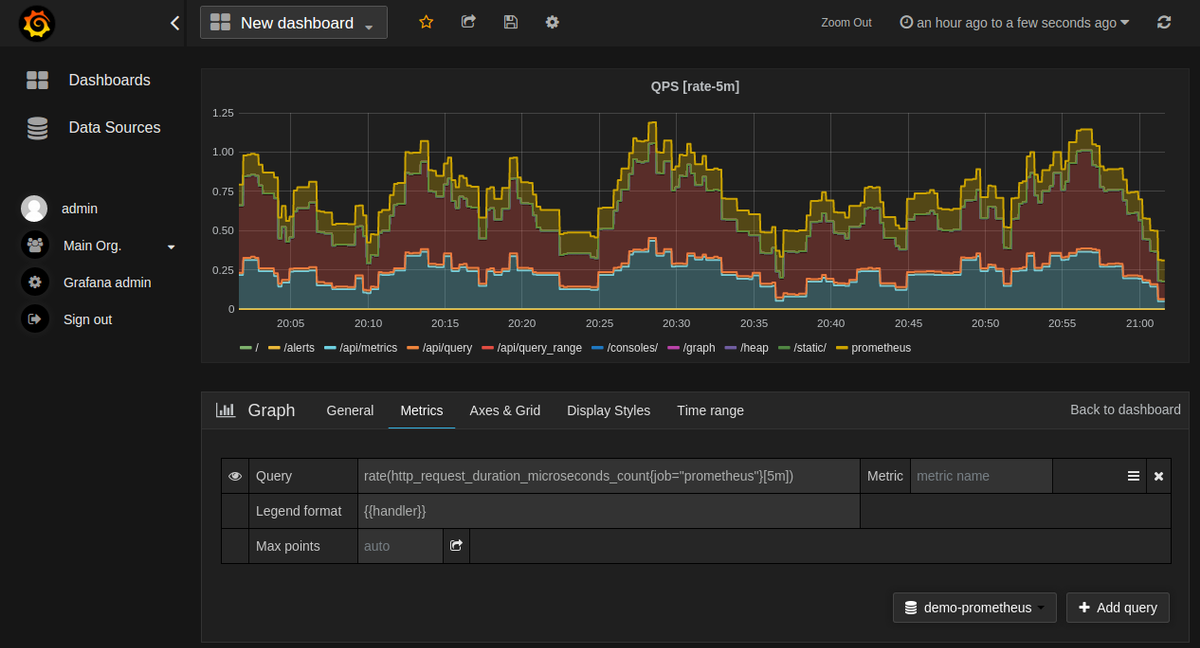
We have now successfully created a graph on Grafana based on time series metrics collected by Prometheus.
Prometheus Templates
Prometheus console templates allow for the creation of arbitrary consoles using the Go templating language. Basically, you can build your dashboard console ahead of time by specifying code instructions on how/what you want your console to look like and what functionalities it should carry out. These are then served from the Prometheus server.
Although console templates are extremely powerful, there is a learning curve. Users new to this style of monitoring are encouraged to try out Grafana first. Given its complexity, and to keep the length of this post at a reasonable length, you can read further on templates from the prometheus docs and grafana.com.
Conclusion
Now that you've taken a look at Prometheus Dashboards, get on our free trial and try it out. Feel free to sign up for a demo and talk to us directly if you have any questions about how MetricFire can help with your monitoring needs.


