Table of Contents
Introduction
Grafana vs InfluxDB – Both offer their cloud services for storing, visualizing and alerting on any kind of time-series data. Both cloud offerings differ from each other in various ways and follow distinct pricing strategies. In this article, we cover the details of Grafana as a service and InfluxDB Cloud, their features and benefits along with their pricing models.
MetricFire is a Hosted Grafana service, where you can use Grafana dashboards directly in the MetricFire platform. MetricFire takes care of the ingestion, storage, maintenance, and updates for your Grafana dashboards. Try out MetricFire's Hosted Grafana dashboards in their free trial!
What is Grafana?
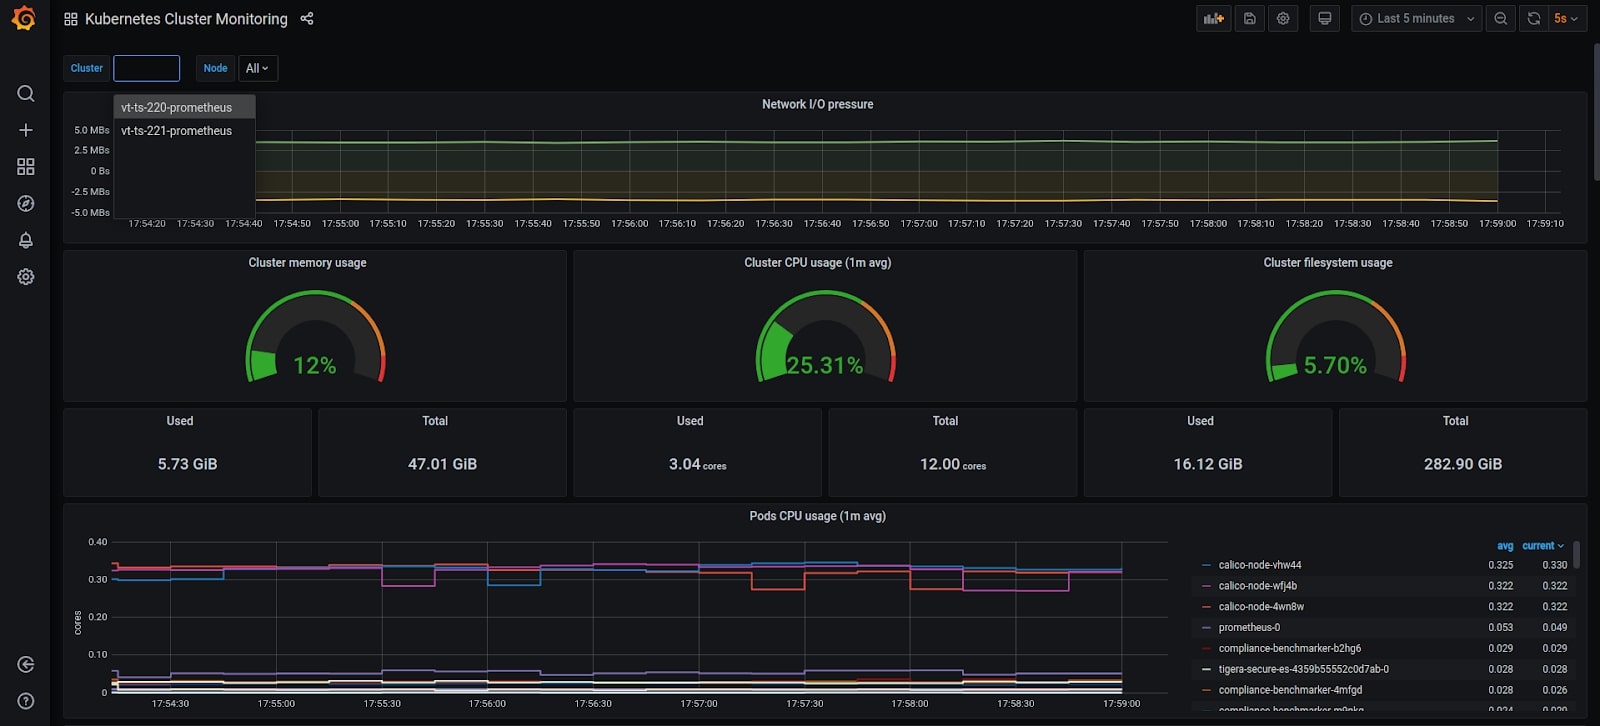
Grafana is an open-source visualization, analytics and monitoring solution developed and supported by Grafana Labs. It lets you query, graph, and alert on your time-series metrics no matter where the data is stored. Grafana has a very lightweight backend and can seamlessly integrate with your workflow to help explore metrics, visualize data, explore logs, evaluate data points, and notify issues in real-time. Grafana supports over 30+ open source and commercial data sources and is backed by a vibrant community of developers. It’s used by thousands of companies today to monitor anything and everything.
Features of Grafana as a Service
Grafana as a service is a premium cloud subscription service provided by MetricFire that offers an intuitive UI with lots of additional features. The service includes scalable, high performance and supercharged backends like Graphite and Prometheus. Grafana as a service is coupled with backend time series databases like Graphite or Prometheus and provides exclusive functionalities like built-in agents, team accounts, granular dashboard permissions, and integration to services like AWS, Heroku and logging tools. These features are not included with the open-source versions and are exclusively provided by the MetricFire product.
Grafana as a Service is easy to set up and only needs an email id to start. Within a couple of minutes, users can start sending metrics and display them into real time interactive dashboards. By default, Grafana service makes three copies of every datapoint and stores them in their distributed database providing 3x redundancy to all your important data. The risk of data loss is highly minimized by services that backup data every hour at no extra cost.
One of the most important features of Grafana as a Service is no vendor lock-in. It lets you export your entire data whenever you want, no questions asked. It also exposes multiple APIs letting users build their own integrations. Users can now choose to store data using tags which can then be used to easily organize these metrics with Data Views.
Grafana as a Service: Pricing Model
Grafana as a Service works on a pay as you grow model. Users have the choice of selecting between Basic, Startup, Growth and Large plans. The Basic Plan starts at $85/month and is for individuals or hobbyists wanting to get started, or for those looking to get a feel for the features of Grafana as a Service. It allows the collection of 750 metrics in parallel and the collected data can be retained for a span of 6 months at a granularity of 30 seconds. 2 Team users and up to 10 alerts can be created under this plan.
The other plans provide data collection of up to millions of metrics and are charged proportionally higher. These plans provide various extra features like longer data retention, more granularity, increased alerting and extra users.
Most of these plans come with a dedicated support from expert engineers and developers ready to jump in and help resolve issues any time. They have a 24x7 on call team that supports users in dealing with their monitoring needs and helps set up automated monitoring for all their tools.
Grafana as a Service has a lot more to offer and is trusted by the biggest companies around the world. Schedule a meeting with the MetricFire Team to get started or try out the free trial yourself.
What is InfluxDB?
InfluxDB is an open source time series database designed and optimized to handle high write and query loads. Users can interact with InfluxDB using its SQL-like query language called InfluxQL. InfluxDB is one of the best time series databases available in the market today and is widely known for its super-fast performance.
MetricFire also has an open database, as the backend is hosted in TimescaleDB - allowing for customers to interact with the database freely. You can also see how InfluxDB's InfluxQL compares to MetricFire's PromQL for the Hosted Prometheus solution in this article here.
InfluxDB 1.x is the stable and recommended version of the TICK (Telegraf, InfluxDB, Chronograf, Kapacitor) stack - it's ready for production use. Recently with the launch of InfluxDB 2.0, Chronograf and Kapacitor were integrated with InfluxDB as a single binary. However, the 2.0 version is currently in beta and is expected to be ready for production soon.
Features of InfluxDB Cloud
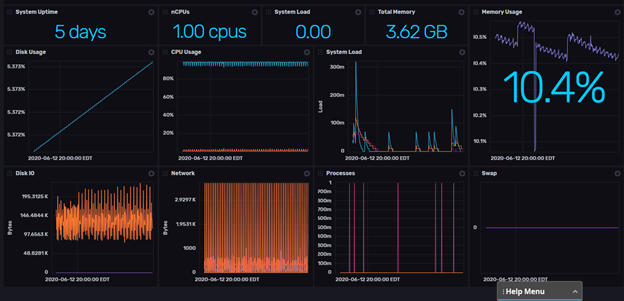
InfluxDB Cloud is InfluxDB’s database-as-a-service offering combined with its in-built visualization component Chronograf and alerting module Kapacitor. InfluxDB Cloud claims to provide the fastest time to results and is easy to set up with just an email ID. The main benefits of using InfluxDB cloud lies in its elastic scalability. Their concept of data storage is serverless and you don’t have to preselect a storage space or VM. Your metrics can grow as you want, and you will only be charged for what you use. Once set up is complete, a wizard guides you with step by step instructions on how to configure data sources and visualize them in dashboards. Depending on the plugins used for data collection, they also provide prebuilt dashboards that can quickly help you visualize your data without having to create your own.
InfluxDB Pricing Model
InfluxDB works on a usage-based model where users are only charged for read, write and storage activities. There is no need to pre-allocate storage resources or define any read/write limits. Charges are flexible depending on your usage.
Their cloud offering is divided into 3 tiers – Free Plan, Usage-Based plan and Annual Plan. The Free Plan is mainly for single users like hobbyists or developers wanting to test out its features. It offers data writes of up to 5Mb/5 minutes and queries of up to 300Mb/5 minutes. A maximum of 5 dashboards, 5 tasks and 2 data bucket creations are allowed. 2 Alerts and 2 notification rules can be created, and alerts can be sent through Slack notifications only. This plan does not cover any desk support or dedicated customer service.
The second plan is Usage-Based Plan and is mainly priced depending on the number of queries, data writes and storage. They provide a flat pricing of $0.0015/MB for writes, $0.0015/second for queries and $0.0015/GB-hr for storage. Along with this, it offers creating unlimited dashboards, tasks and data buckets. They also offer no limits on data retention and alert rule creation. Alerts could be easily sent though channels like Slack, HTTP and PagerDuty. Some Help Desk Support is also provided depending on the billing amounts.
And the last model is an Annual Plan which includes everything offered in the above usage-based model along with extra channels for event handling. The quote for the annual model is received only upon request and may differ depending on your needs.
Conclusion
Both Grafana as a Service and InfluxDB Cloud can store your data, help you visualize using colourful dashboards and alert you for any data degradation. Both are easy to set up and can be ready to ingest data within minutes. However, Grafana has a lot more to offer in terms of its radiant visualizations and advanced plugins that can help you display anything and everything.
While Grafana as a Service and InfluxDB Cloud has different subscription models, it really depends on the user to first decide on what amount of data they expect to store, the amount they expect to fetch and display, the number of users using the dashboards, the duration of data being stored, the kind of support they want etc. While none of these needs to be exact and may always dynamically grow or reduce over time, a ballpark figure of your expectation makes it a lot easier to compare the prices and helps you decide on your expenses.


