

Table of Contents
- Introduction
- Understanding DigitalOcean
- Basics of DigitalOcean Monitoring with Droplets
- Monitoring DigitalOcean with MetricFire
- Integrating MetricFire with DigitalOcean
- Advantages of Using MetricFire for Monitoring DigitalOcean
- Comparing MetricFire and DigitalOcean’s Native Tools
- MetricFire’s Superior Performance in Use Cases
- Conclusion
Great systems are not just built. They are monitored.
MetricFire runs Graphite and Grafana as a fully managed service for small engineering teams, taking care of storage, scaling, and version updates so your team doesn't have to. Plans start at $19/month, billed per metric namespace rather than per host, and include engineer-staffed support. Integrations work natively with Heroku, AWS, Azure, and GCP, and data is stored with 3× redundancy in SOC2- and ISO:27001-certified data centres.
Introduction
Cloud monitoring is like a health check-up for our online spaces. It tells us what's going well and what we need to improve. It is critical because it lets us fix problems before they get too big and helps our online services work at their best. This article talks about how we can use MetricFire to monitor DigitalOcean environments.
Understanding DigitalOcean
DigitalOcean has been a go-to cloud infrastructure provider since its inception in 2011. It simplifies cloud technologies and is designed to make running and scaling applications smooth and efficient.
DigitalOcean's Droplets
"Droplets" are DigitalOcean's unique offering. These are flexible, Linux-based virtual machines that act as servers. Each Droplet is a new, easy-to-deploy server, simplifying the application deployment process in the cloud. You can create a Droplet via the DigitalOcean control panel or using the DigitalOcean API, for example:
curl -X POST "https://api.digitalocean.com/v2/droplets" \
     -d'{"name":"example.com","region":"nyc3","size":"s-1vcpu-1gb","image":"ubuntu-18-04-lts"}' \
     -H "Authorization: Bearer YOUR_API_TOKEN" \
     -H "Content-Type: application/json"
This command creates a new Droplet with the name 'example.com', in the 'nyc3' region, with the size 's-1vcpu-1gb' and Ubuntu 18.04 LTS as the image.
Managed Databases by DigitalOcean
DigitalOcean's Managed Databases are a boon for businesses. These are fully managed database engines, meaning DigitalOcean takes care of the chores—updates, backups, scaling—allowing you to focus on your application.
Kubernetes in DigitalOcean
DigitalOcean also provides Kubernetes, a service that automates, scales, and manages containerized applications. This means you can group your containers into logical units, making them easy to discover and manage.
DigitalOcean's VPC Networking
VPC, or Virtual Private Cloud, is another vital feature offered by DigitalOcean. VPC is a private network interface for DigitalOcean resources, offering secure and private space for your resources, thereby increasing your data's security.
The Importance of Monitoring in DigitalOcean
Monitoring in DigitalOcean is to having a regular health check-up for your services. It provides real-time insights into the performance of your resources. By monitoring metrics like CPU usage of your Droplets or data usage in your network, you can spot and fix issues before they escalate. Therefore, monitoring is essential in ensuring your DigitalOcean services are always running at their best.
Basics of DigitalOcean Monitoring with Droplets
DigitalOcean's monitoring capabilities empower you to monitor your cloud resources, particularly Droplets, ensuring they're operating optimally. Understanding the basics of monitoring with Droplets will help you manage your infrastructure effectively.
How Does Monitoring Work in DigitalOcean?
Monitoring within DigitalOcean revolves around the use of the DigitalOcean Monitoring Agent. This agent is a small piece of software that you install onto your Droplets. Once installed, the agent collects and sends system metrics to DigitalOcean regularly. It's like having a health check-up for your Droplets.
To install the monitoring agent, you can use the following command on your Droplet:
curl -sSL https://repos.insights.digitalocean.com/install.sh | sudo bash
This will download and install the agent, then gather data and send it back to DigitalOcean.
Monitoring DigitalOcean with MetricFire
As we deepen our understanding of the intricacies of cloud monitoring, it becomes increasingly clear that some monitoring solutions stand out from the rest. One such tool is MetricFire, an industry-leading platform renowned for its impressive capacity to monitor infrastructure, networks, and applications.
An Overview of MetricFire
MetricFire is a comprehensive monitoring solution that delivers in-depth insights into your system's performance. The two primary services, Hosted Graphite and Hosted Grafana provide a detailed, granular look at your system's health, offering customizable dashboards, advanced alerting capabilities, and integrations with many other services.
Its open-source nature and robust API access further extend its adaptability, making it an excellent fit for various use cases.
Integrating MetricFire with DigitalOcean
Monitoring your DigitalOcean infrastructure with MetricFire adds more depth to your data analysis and system optimization. To achieve this, you need to integrate MetricFire with DigitalOcean, and the following step-by-step guide will walk you through the process.
Create a MetricFire Account
The first step is to create a MetricFire account if you don't have one already. Visit MetricFire's website and sign up for a new account. Once your account is ready, you can access the dashboard.
Navigate to the 'Add Source' Tab
On the MetricFire dashboard, look for the 'Add Source' tab. This tab is where you can integrate various data sources with MetricFire. You'll want to find and select the 'DigitalOcean' option for this guide.
Generate a Personal Access Token on DigitalOcean
Before you can integrate MetricFire with DigitalOcean, you'll need to provide your DigitalOcean API credentials. This involves generating a Personal Access Token (PAT) from your DigitalOcean account. Here's how:
- Log in to your DigitalOcean account and navigate to the API section.
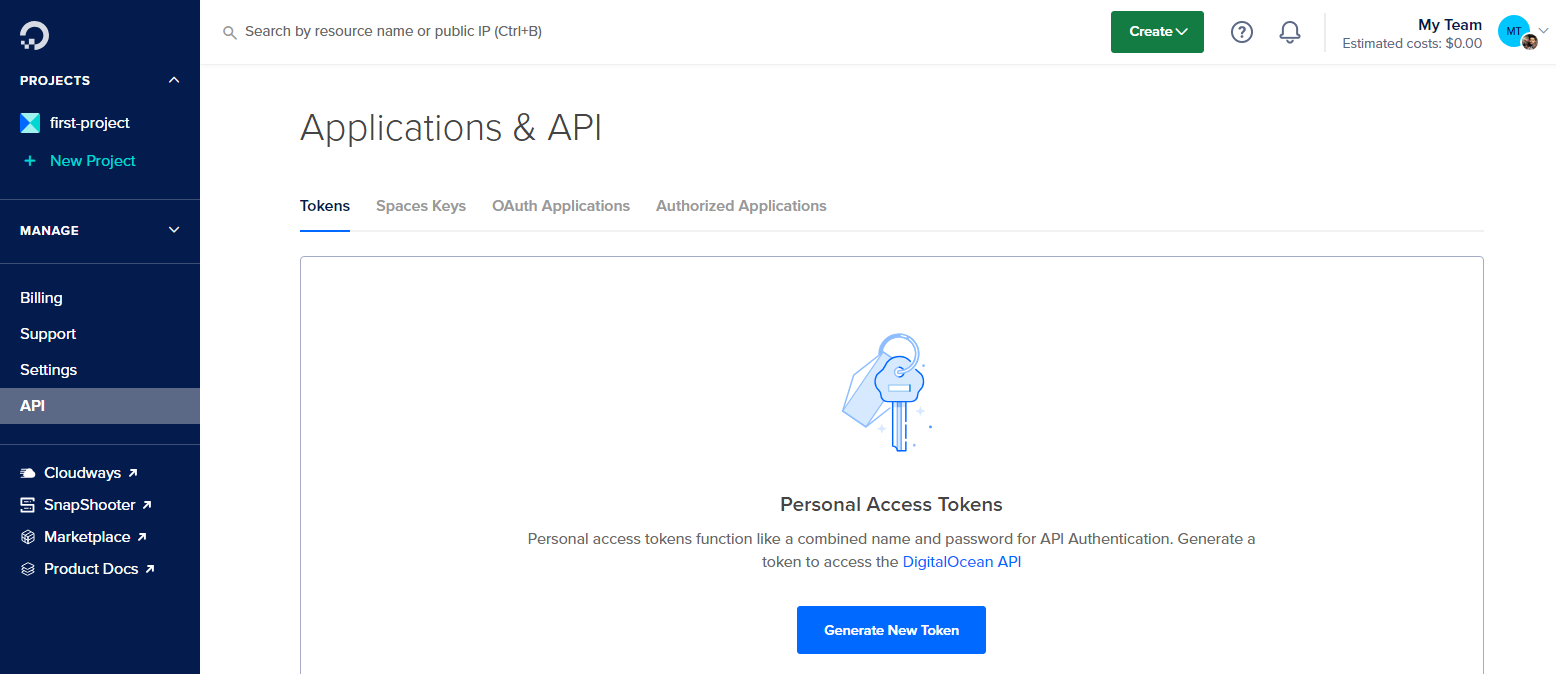
- Click on the 'Generate New Token' button.
.
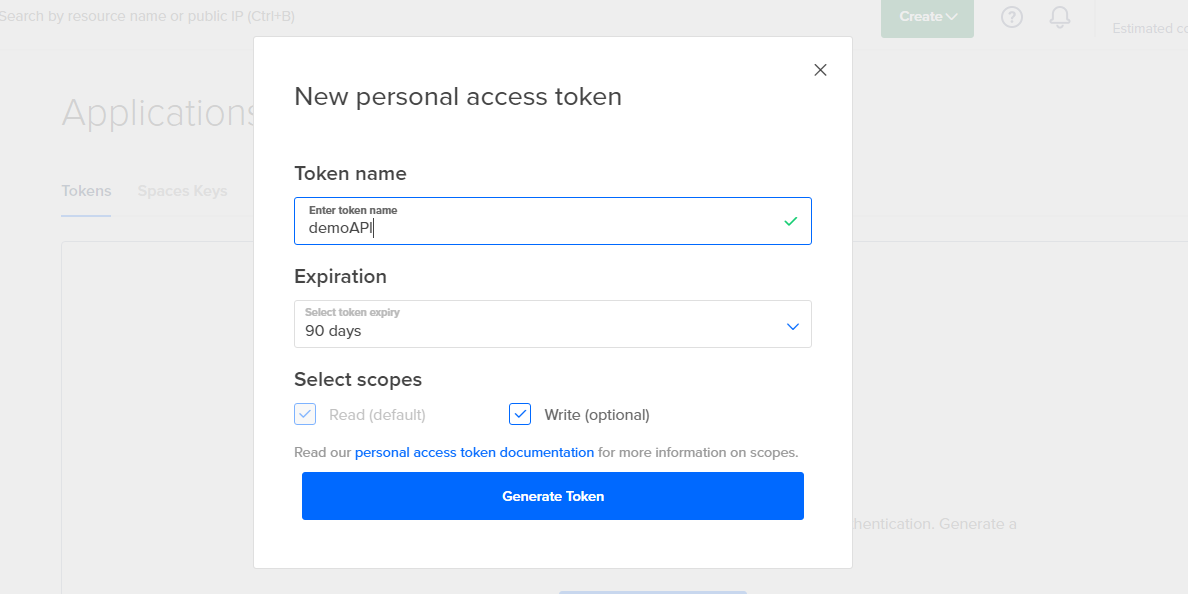
- Name the token appropriately, ensure both 'Read' and 'Write' permissions are selected, and click 'Generate Token'.
-
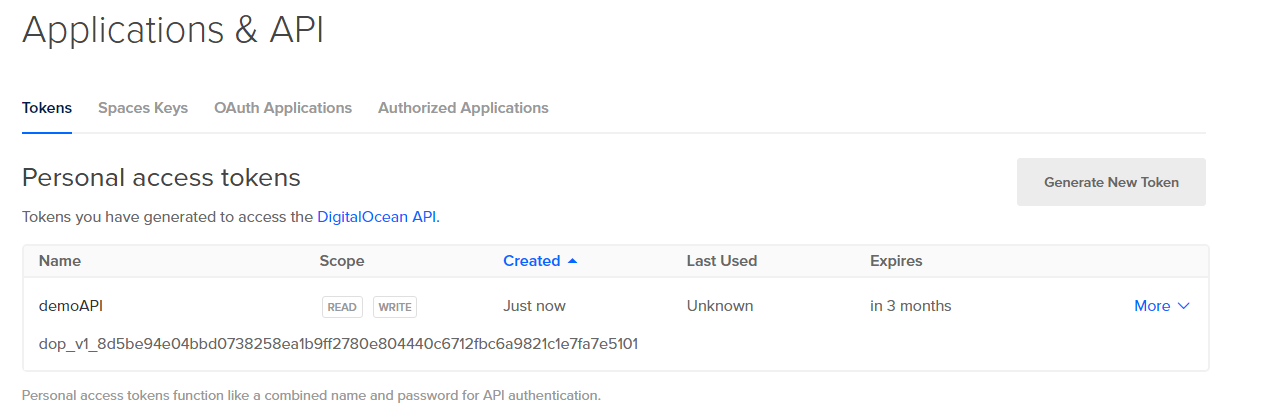
Once the token is generated, copy it. Keep it secure as it won't be shown again.
Initiate Integration
Here are the steps to integrate MetricFire with DigitalOcean by installing the agent:
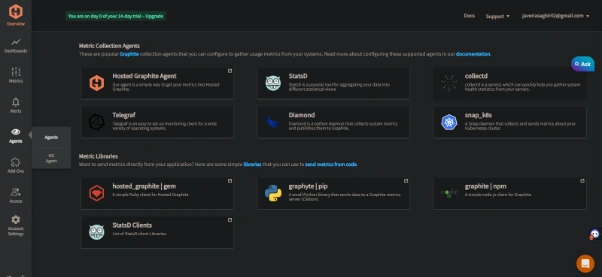
Select and set up an agent
Numerous agents are available by MetricFire for data collection. So choose one and install it according to your requirements. For instance you can install Telegraf.
Configure the agent
You must configure the integration in your MetricFire dashboard after the installation of the agent. The Agent Telegraf is set up and providing data to MetricFire from your DigitalOcean resources.
Enable DigitalOcean Input Plugin
You will need to configure the file to collect metrics from DigitalOcean account by enabling DigitalOcean plugin.
Save and Restart Telegraf
Then save the configuration file and restart telegraf for applying the changings. After this, wait for a few minutes until Telegraf collects metrics from your DigitalOcean account.
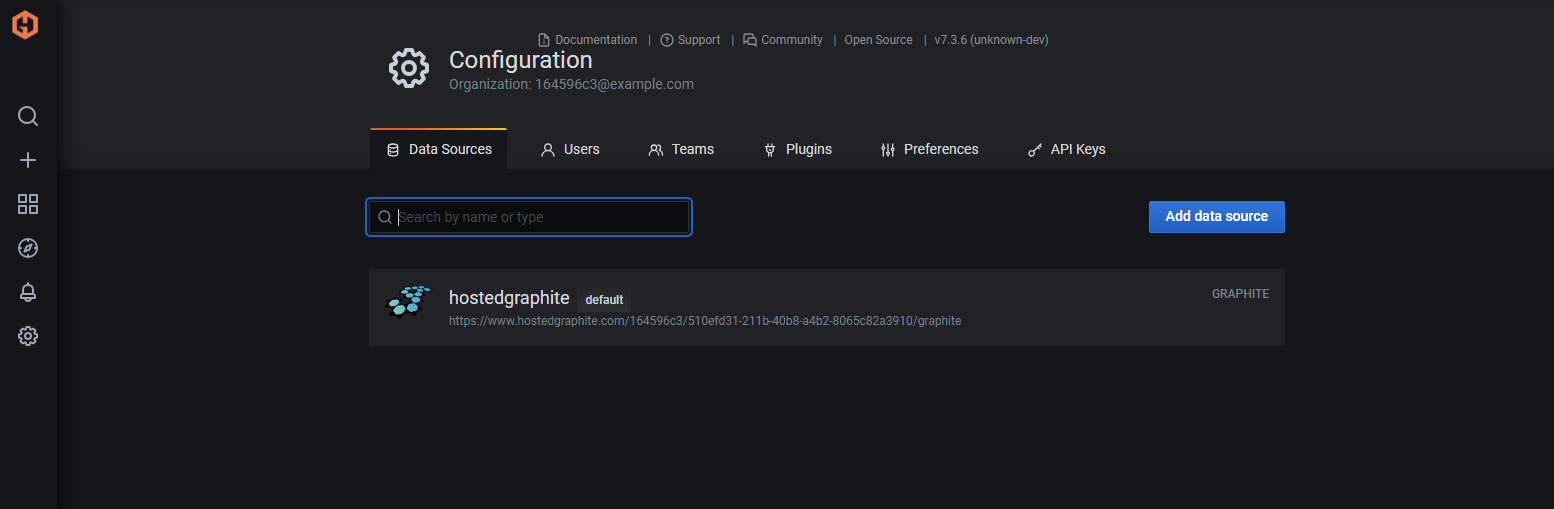
Configure MetricFire with DigitalOcean
Configure all the necessary information such as IP address and metrics ports to start collecting data from DigitalOcean.
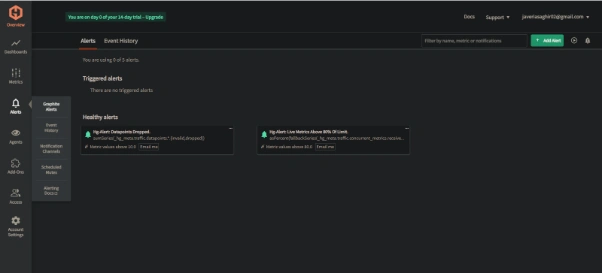
Create dashboards and Alerts
MetricFire offers dashboard builder by which you can view metrics in real-time by building personalized dashboards. You can also be able to learn further about the infrastructure’s condition and functions. Moreover, It also lets you get notifications by making alerts.
Advantages of Using MetricFire for Monitoring DigitalOcean
MetricFire distinguishes itself through its unique features and advantages in a world teeming with monitoring solutions, especially when applied to DigitalOcean environments. Its adaptability, advanced alerting system, and API access for custom metrics are some of the elements that make it stand out.
Unique Advantages of MetricFire
-
MetricFire's scalability is a prominent advantage. As your business grows, your monitoring needs expand correspondingly. MetricFire is designed to scale up effortlessly with your growth, maintaining its performance irrespective of the volume of metrics it needs to handle.
-
Another key advantage is MetricFire's advanced alerting capability. This feature allows you to customize alerts for various metrics, sending notifications via channels like email or Slack when set thresholds are breached. The alerting system's sensitivity can be finely tuned, ensuring you are promptly notified of any potential issues without being overwhelmed by false positives.
-
Finally, MetricFire's API access for custom metrics allows for adding business-specific data into your monitoring regimen. With this feature, you can monitor and alert on any key performance indicator (KPI) critical to your business, providing a more comprehensive and tailored view of your system's health.
Comparing MetricFire and DigitalOcean's Native Tools
While DigitalOcean's native monitoring tools provide basic insights into your Droplets' performance, MetricFire goes several steps further. It offers more granular metrics, a more flexible alerting system, and the ability to incorporate custom metrics. These features provide a more holistic and detailed view of your infrastructure, facilitating better decision-making and proactive problem-solving.
MetricFire's Superior Performance in Use Cases
Consider a scenario where you must scale your application based on user load. While DigitalOcean's native tools can provide basic CPU and bandwidth usage data, MetricFire can monitor a wider range of metrics, including memory usage and server load, allowing for more accurate auto-scaling decisions.
Suppose you want to track a business-specific KPI, such as the number of active users on your platform. DigitalOcean's native tools do not provide this level of customization. However, with MetricFire's custom metrics API, you can easily track this KPI, setting alerts to notify you when the user count exceeds or falls below certain thresholds.
Conclusion
Monitoring is an auxiliary feature of cloud management and an indispensable tool that drives performance optimization, resource allocation, and proactive problem-solving. By harnessing the power of MetricFire, you'll not only enhance the depth and breadth of your monitoring capabilities, but you'll also get access to a toolkit designed for your evolving needs.
As we wrap up this discussion, we strongly encourage you to consider MetricFire as your go-to tool for monitoring your DigitalOcean environment. Try MetricFire today and see how it revolutionizes your monitoring experience.


