
 +
+

To integrate Digital Ocean with MetricFire, please sign up for a free 14 day trial. We want to fully understand your requirements and monitoring goals, so we can advise you on how to obtain better visibility into your infrastructure. Please book a demo with us so we can show you how quick and easy it is to get meaningful data into your MetricFire account, and use that data to build custom dashboards and alerts.
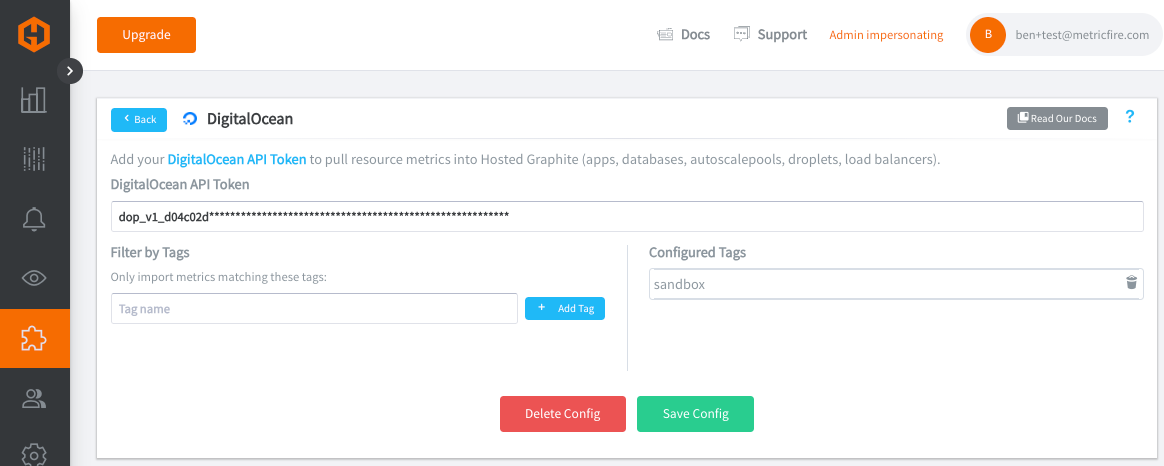
MetricFire's DigitalOcean integration helps you collect, visualize, and alert on infrastructure metrics from your DigitalOcean account. Once configured, metrics are pulled from the DigitalOcean API every 10min and ingested into your Hosted Graphite account. This integration is useful for teams running production workloads on DigitalOcean who want centralized visibility across droplets, managed databases, apps, load balancers, and autoscale pools.
To enable the integration, create a DigitalOcean API token with read access, then add it to your MetricFire integration configuration. MetricFire will use that token to query supported DigitalOcean resources and import metrics into your Hosted Graphite account to be used in dashboards, and connected to MetricFire alerts.
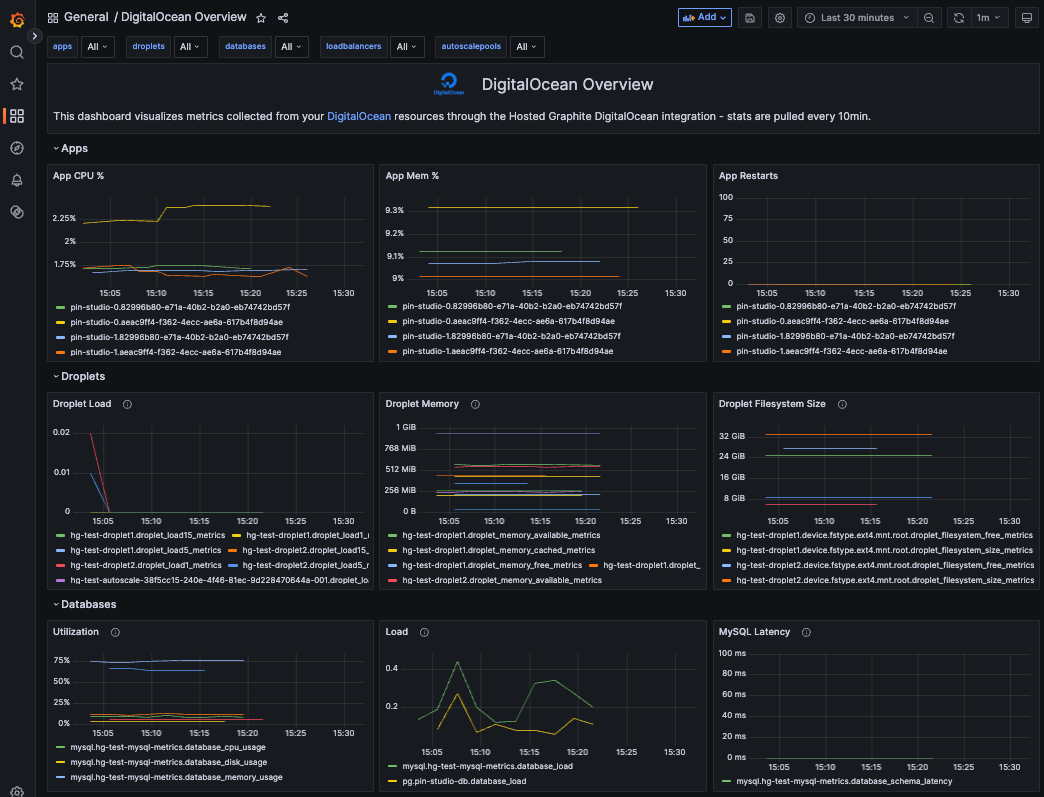
Once metrics are flowing into MetricFire, you can generate our DigitalOcean Overview dash from our Dashboard Library. This makes it easier to correlate DigitalOcean infrastructure behavior with application performance and incident timelines.
See the Hosted Graphite docs for more information on configuring integrations and dashboards.
MetricFire is a full-scale platform that provides infrastructure, system, and application monitoring using a suite of open-source tools. We will aggregate and store your data as time series metrics, which can be used to build custom dashboards and alerts. MetricFire takes away the burden of self-hosting your own monitoring solution, allowing you more time and freedom to work on your most important tasks.
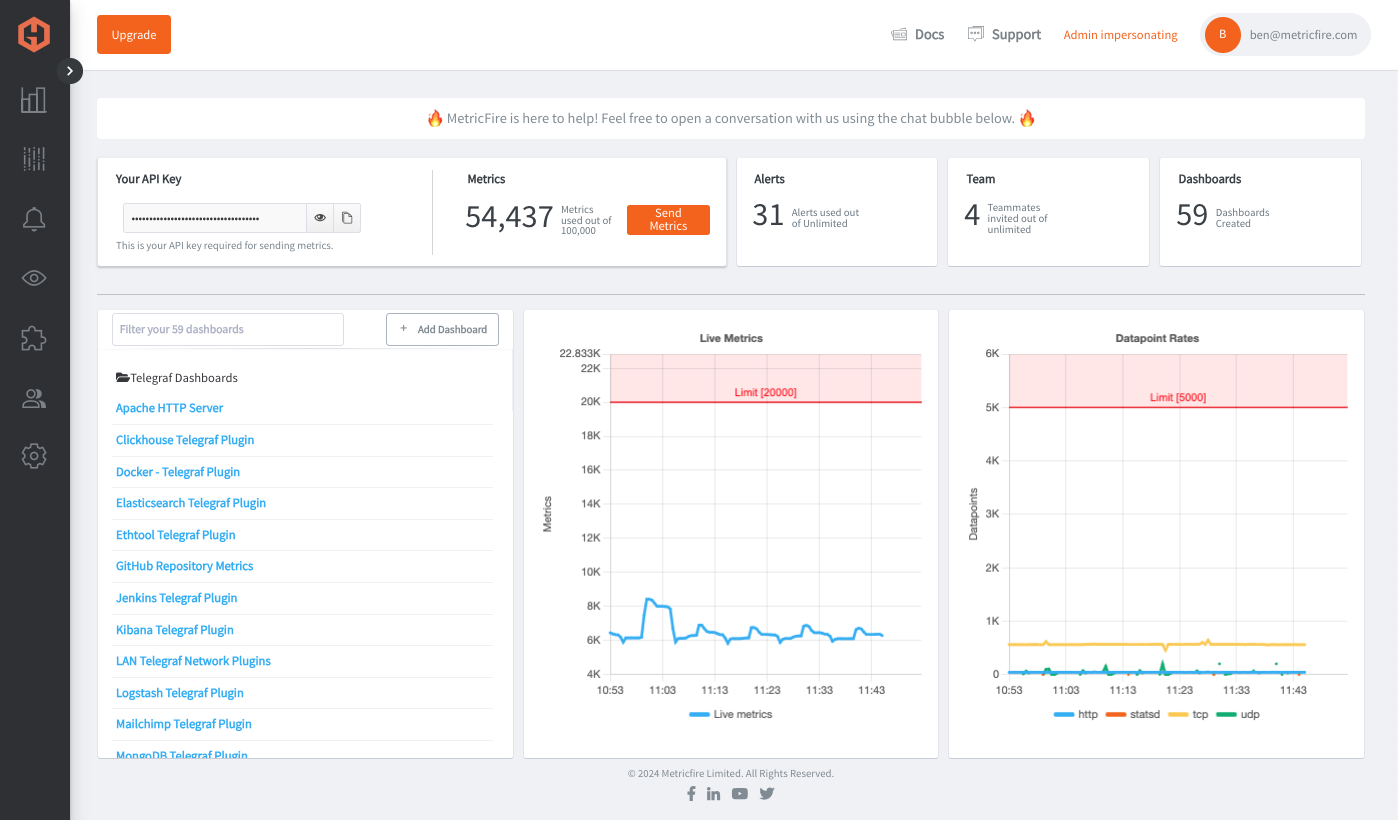
MetricFire offers a complete ecosystem of end-to-end infrastructure monitoring, comprised of open-source Graphite and Grafana. MetricFire handles the aggregation, storage, and backups of your data, and offers alerting, team features, and API's for easy management of your monitoring environment. You can send server metrics using one of our agents, custom metrics from within your application code, and integration metrics from a variety of popular 3rd party services that we integrate with like Heroku, AWS, Azure, GCP, and many more!
Our Hosted Graphite product has improved upon standard Graphite to add data dimensionality, optimized storage, and offers additional tools and features that provide customers with a robust and well-rounded monitoring solution.


“We now have over ten times the amount of metrics we started with, and on different accounts. One of the great things about MetricFire is that scaling to support this increase has been hassle-free, requiring no additional work on our side.”
“Building and managing an on-premise installation at this scale would require a lot of engineer time, especially in the first year...we use this engineering time to work on initiatives closer to our core business”
“There’s complete transparency with everything MetricFire do which means we can accurately predict what we’ll be spending and comfortably keep within our budget.”
"Every time I have a question, I get an answer from support after just a couple of hours. Their technical knowledge is excellent.”
今回は、OpenTelemetryを使ってNGINXのパフォーマンスを監視する方法を解説。NGINXの設定からOpenTelemetry Collectorの導入、Graphiteへのメトリクス送信、Grafanaダッシュボードやアラート作成までをわかりやすくご紹介します。 Continue Reading
今回は、OpenTelemetryを使ってNGINXのパフォーマンスを監視する方法を解説。NGINXの設定からOpenTelemetry Collectorの導入、Graphiteへのメトリクス送信、Grafanaダッシュボードやアラート作成までをわかりやすくご紹介します。 Continue Reading
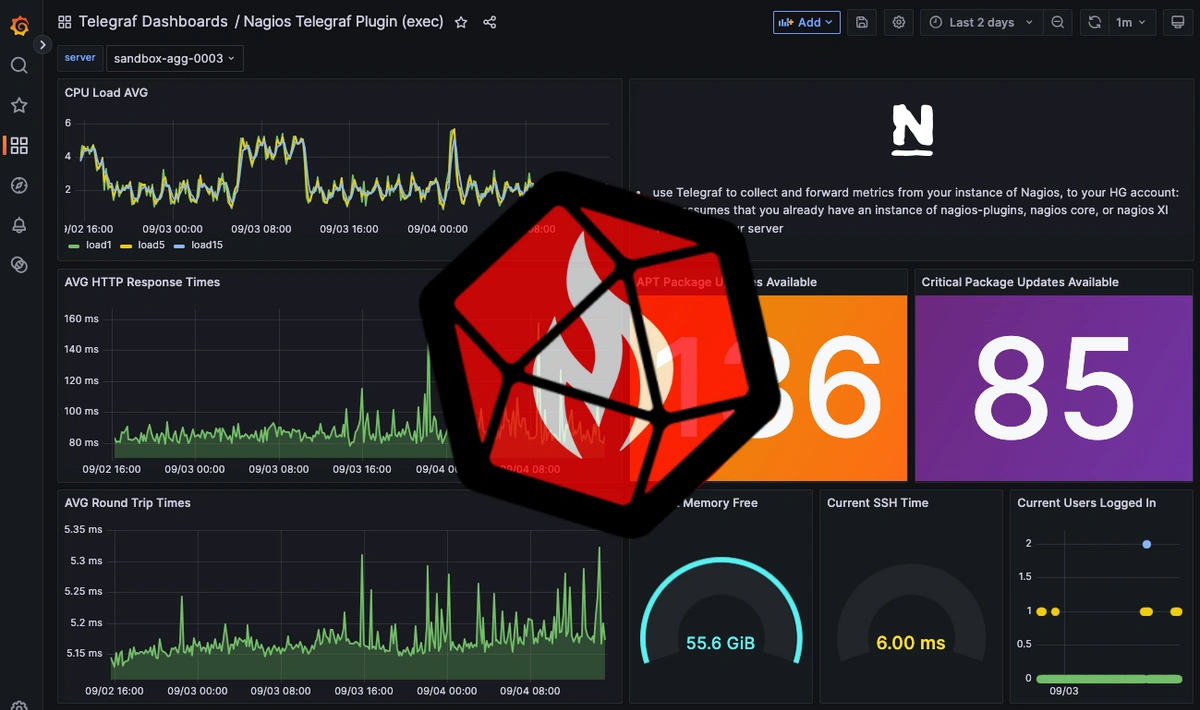
Telegrafを使用してNagiosプラグインを監視する方法を解説。Nagios Pluginsの設定、Telegraf execプラグインによるメトリクス収集、Hosted GraphiteとGrafanaを活用したダッシュボード・アラート構築までをステップごとに紹介します。 Continue Reading