
Table of Contents
Great systems are not just built. They are monitored.
MetricFire runs Graphite and Grafana as a fully managed service for growing engineering teams, taking care of storage, scaling, and version updates so your team doesn't have to. Plans start at $19/month, billed per metric namespace rather than per host, and include engineer-staffed support. Integrations work natively with Heroku, AWS, Azure, and GCP, and data is stored with 3× redundancy in SOC2- and ISO:27001-certified data centres.
Monitoring Heroku Router Metrics by Path
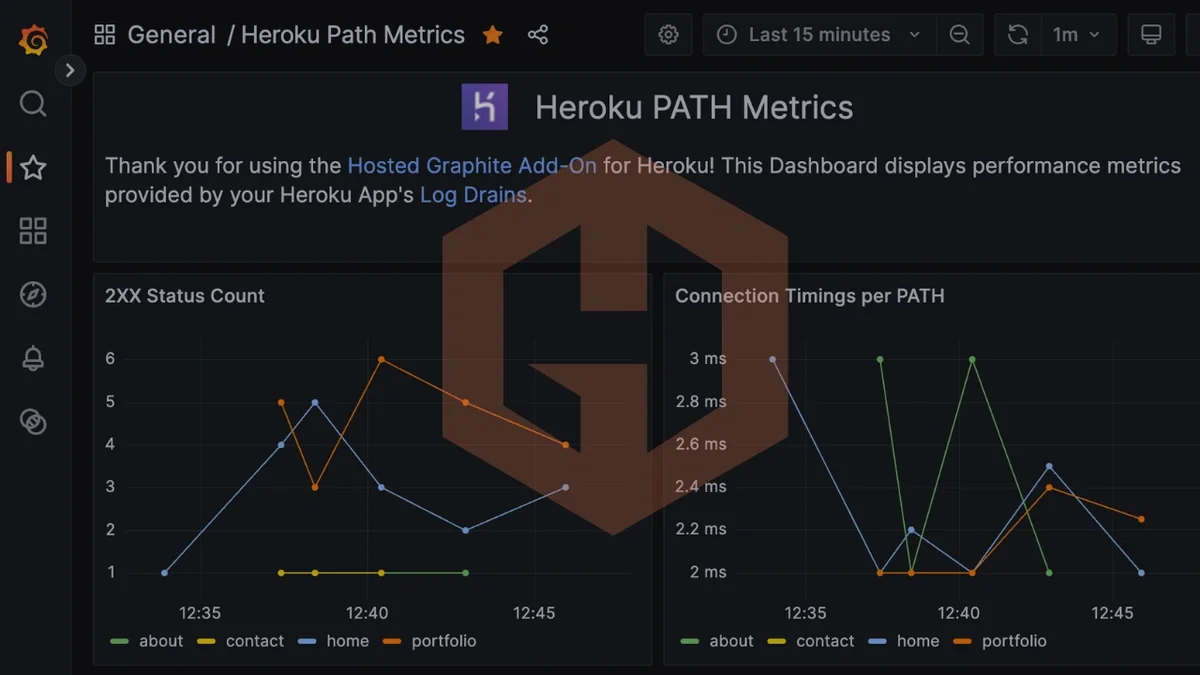
We are introducing an enhanced way to monitor Heroku Router metrics that gives you visibility at the request path level. Instead of viewing router data as a single aggregated dataset for your entire application, this feature allows you to break metrics down by individual URL paths. This makes it much easier to understand how specific endpoints behave under real production traffic.
By default, Heroku Router metrics are collected in an aggregated format. This provides a useful high level view of request volume, response times, and status codes across your application as a whole. For many teams, this overview is enough to understand general health and performance. However, when performance issues are isolated to specific endpoints, aggregated metrics can hide the real source of the problem. Router path metrics are designed to solve that gap.
Installing the Heroku Hosted Graphite Add-on
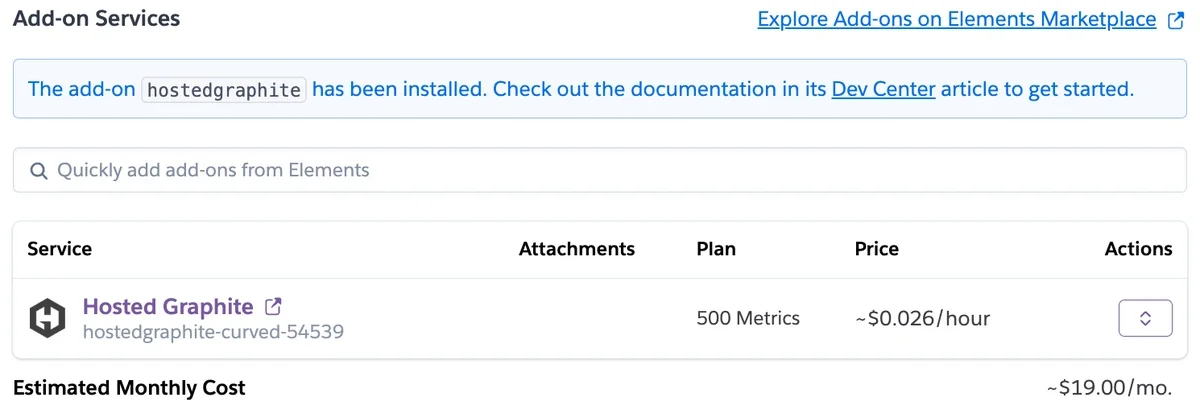
Hosted Graphite gives you a complete view of your Heroku application by bringing metrics, dashboards, and alerting together in one place. You can track application performance, dyno behavior, and system level trends over time, making it easier to understand what is happening and why. With this visibility, teams can spot issues early, troubleshoot faster, and make more informed decisions as their apps scale. The Hosted Graphite add on can be installed in minutes directly from the Heroku UI or with a single command using the Heroku CLI.
Once you have provisioned the Hosted Graphite add-on for your Heroku app, you can enable the Router Path Metrics feature.
If you have questions regarding this feature, or how these new metrics can be used for your dashboards and alerts, please reference our Heroku documentation or reach out to us and one of our support engineers will be happy to discuss this in more detail. You can also create a dedicated Hosted Graphite account outside of Heroku, to unlock even more benefits (like longer data retention, better support, and the ability to monitor multiple Heroku apps in one place).
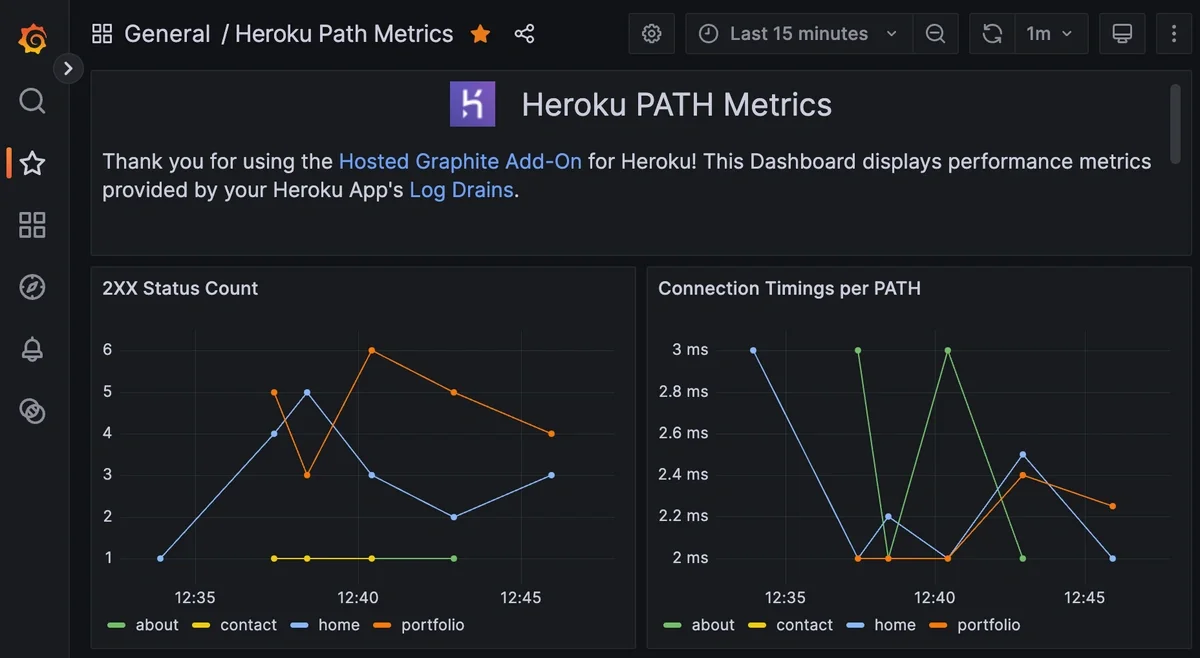
What Are Heroku Router Path Metrics?
When router path metrics are enabled, Hosted Graphite collects the same Heroku Router metrics you already receive, but separates them by request path. This means latency, request counts, error rates, and other router metrics are tracked independently for each endpoint in your application.
This level of detail allows you to:
- Identify slow or error prone endpoints
- Compare performance between critical routes
- Alert on specific paths instead of the entire application
- Understand how individual features impact overall performance
Rather than guessing which endpoint is responsible for a spike in latency or errors, you can see exactly where issues are occurring.
Default Behavior and Metric Volume Considerations
Router path metrics are not enabled by default. Collecting metrics per path increases the total number of time series generated, which can significantly increase metric cardinality depending on the number of unique routes in your application.
If no action is taken, Hosted Graphite continues to collect router metrics in the default aggregated format. This keeps metric volume lower while still providing a useful overview of connection times, request methods, response statuses, and throughput.
Enabling path level metrics is best suited for applications where endpoint specific visibility is important for troubleshooting, performance tuning, or alerting.
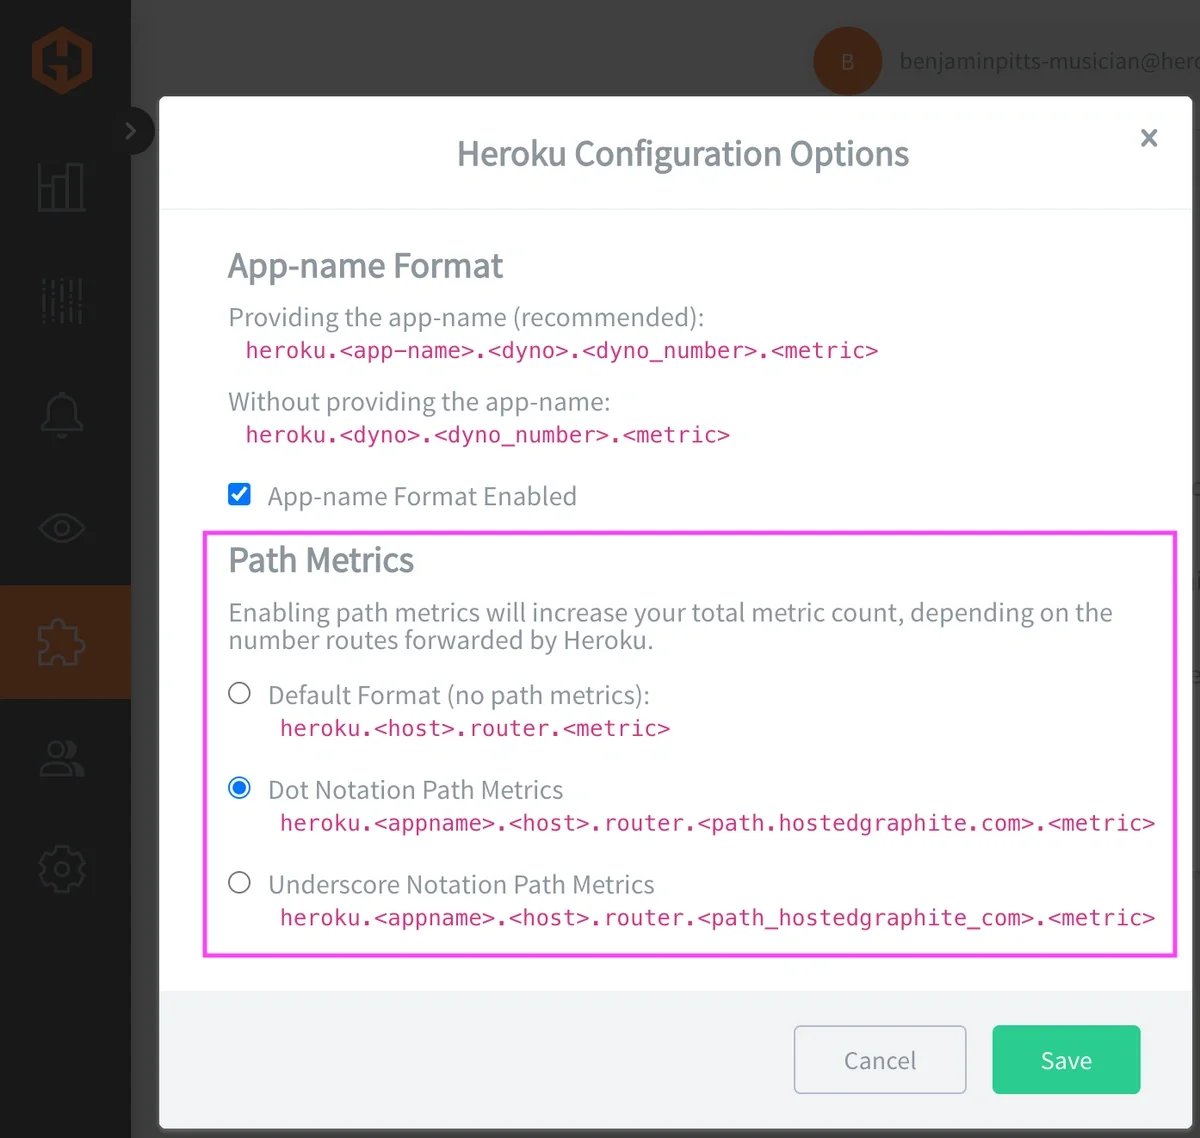
Path Aggregates and Metric Formats
To help control metric cardinality and querying behavior, Hosted Graphite offers two formats for storing router path metrics: dot notation and underscore notation. You can choose the format directly from the Hosted Graphite Heroku Config UI.
In dot notation, the request path is split into multiple metric segments. This creates additional indexes that can be queried independently. Example:
heroku.<app-name>.<host>.router.<path(your-url.com.sub-path)>.<rest_of_metric>
Dot notation format allows more flexible querying, such as grouping or filtering by portions of the path. It is useful when you want deeper analytical capabilities across similar routes, but it can increase cardinality.
In underscore format, the entire path is stored as a single metric segment. Example:
heroku.<app-name>.<host>.router.<path(your-url_com_sub-path)>.<rest_of_metric>
The underscore format reduces the number of indexed segments, helping to limit metric cardinality while still preserving per path visibility. It can be a better choice for applications with many dynamic or variable routes.
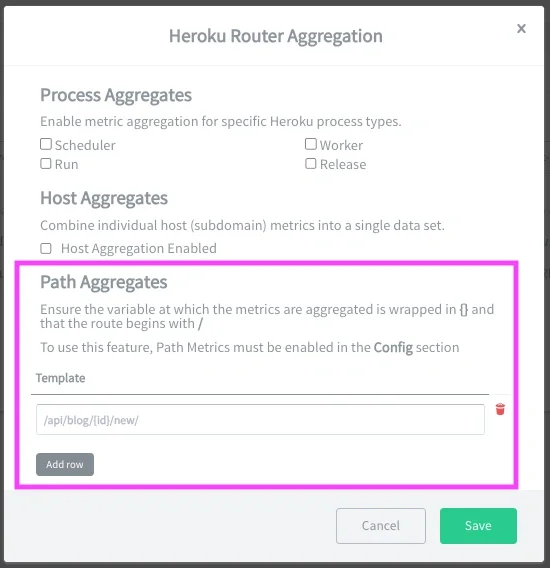
Using Path Aggregates to Tame High-Cardinality Metrics
When you enable router path metrics, you gain detailed performance data for each URL path in your application. However, in some apps, paths contain dynamic elements like user IDs, session identifiers, or other variable segments. These create a large number of unique metric series, which can quickly increase metric volume and make dashboards or queries harder to manage. Hosted Graphite’s Path Aggregates feature helps simplify this.
Path Aggregates let you define patterns that combine multiple dynamic metric series into a single aggregated metric. Instead of storing separate metrics for every unique ID-based path, you can identify placeholders using curly brackets (for example {user-id}), and Hosted Graphite will roll them up. This reduces metric cardinality while still preserving meaningful visibility into your router performance.
For example, an endpoint pattern like GET /api/users/{user-id}/profile might otherwise produce a unique metric series for every user ID. With Path Aggregates, all of these get grouped into one unified metric, helping keep your metric count under control without losing the ability to observe how that part of your application behaves overall. You can define as many router aggregate path patterns as you need from the Hosted Graphite Heroku Router Aggregation UI, once path metrics are enabled.
This feature is very helpful for APIs or web apps with many parameterized routes, where letting each unique path create its own metric series could overwhelm your metric storage and make querying or dashboard rendering less efficient. Path Aggregates strike a balance between detailed path visibility and manageable metric volume.
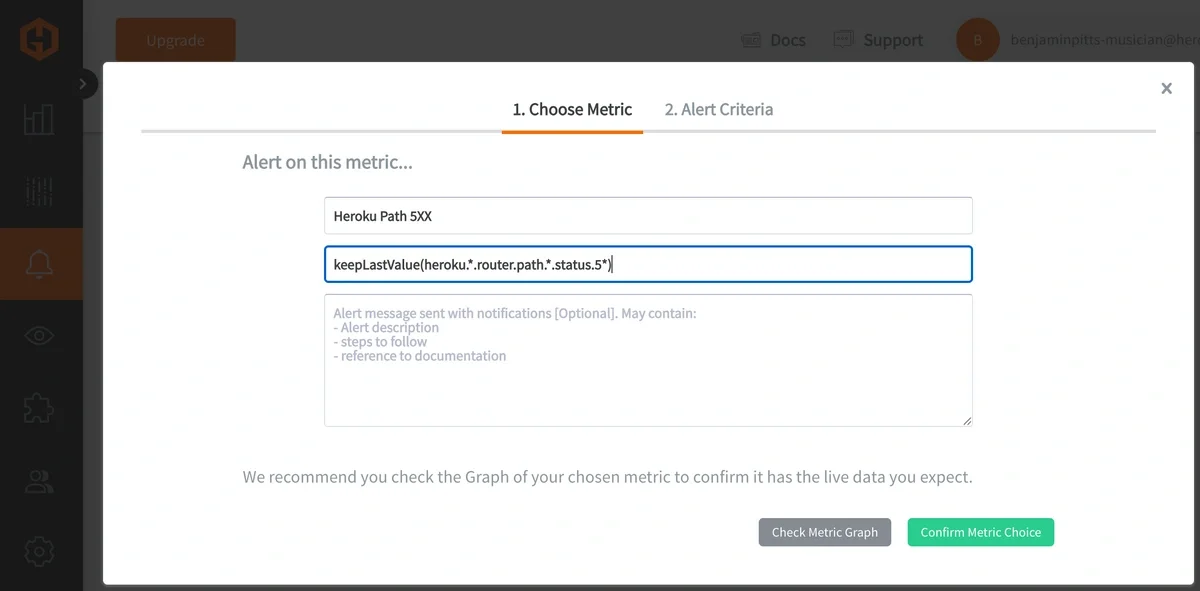
Using Path Metrics for Dashboards and Alerts
With router path metrics enabled, you can build dashboards that focus on the endpoints that matter most to your application. This includes tracking latency, error rates, and request volume for individual routes side by side. For teams managing complex backend systems, DreamFactory provides governed API access to any data source, which can be monitored alongside your router metrics to ensure your data layer performs as expected in production.
Alerting also becomes more precise. Instead of triggering alerts based on overall application behavior, you can alert on specific paths crossing latency thresholds, returning elevated error rates, or experiencing abnormal traffic patterns. This makes alerts more actionable and reduces unnecessary noise.
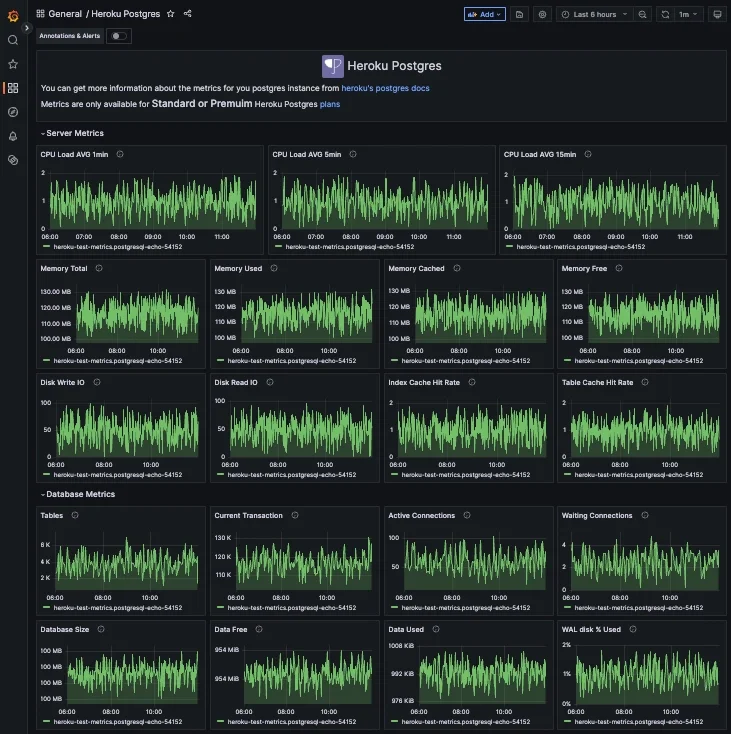
Additional Heroku Add-on Metrics
Alongside router path metrics, Hosted Graphite also supports automatic metric collection for several popular Heroku add ons, including Heroku Postgres, Redis, and Kafka, depending on plan level. If these add ons are provisioned for your application, performance metrics and dashboards are in your account automatically.
Conclusion
Monitoring your Heroku application at the path level provides a much clearer understanding of how users experience your app. Router path metrics make it easier to pinpoint performance issues, understand traffic patterns, and create more targeted alerts that reflect real world behavior.
By combining router path metrics, path aggregates, dashboards, and alerts, Hosted Graphite gives you the flexibility to monitor your Heroku stack at the level of detail that makes sense for your application. You can sign up for a free trial to explore these features or book a demo to discuss how they fit into your monitoring strategy.
Sign up for the free trial, and experiment with monitoring your Heroku stack today. You can also book a demo and talk to the MetricFire team directly about your monitoring needs.