
Table of Contents
Great systems are not just built. They are monitored.
MetricFire runs Graphite and Grafana as a fully managed service for growing engineering teams, taking care of storage, scaling, and version updates so your team doesn't have to. Plans start at $19/month, billed per metric namespace rather than per host, and include engineer-staffed support. Integrations work natively with Heroku, AWS, Azure, and GCP, and data is stored with 3× redundancy in SOC2- and ISO:27001-certified data centres.
Introduction
In the realm of system monitoring, logs provide detailed insights while metrics offer a streamlined view of system performance. This guide demonstrates how to transform some raw logs into usable metrics using a lightweight, open-source setup. We'll also use the Telegraf agent to convert logs into Graphite metrics that you can easily visualize and alert on. This is ideal for system admins, DevOps beginners, or anyone interested in building more innovative monitoring pipelines from scratch. If you don't already have a Hosted Graphite account with MetricFire to get started with this tutorial, sign up for a free 14-day trial HERE.
In this example, we will use Grok search patterns to pull syslog messages and forward them to a data source using Telegraf Input Plugins.
If you don't love configuring Grok patterns, check out Part 1 of our 'logs to metrics' series, where we detail how to convert similar syslog messages into Graphite metrics using Loki, Telegraf, and a simple Python script.
Key Takeaways:
-
Enhanced Observability: Transforming logs into metrics provides a concise view of system performance, facilitating easier monitoring and alerting.
-
Customizable Parsing: Grok patterns allow for tailored extraction of relevant data from logs, ensuring metrics are aligned with specific monitoring needs.
-
Scalable Solution: Utilizing Telegraf and Graphite offers a lightweight and scalable alternative to heavier log management stacks.
-
Improved Responsiveness: Metrics derived from logs enable quicker detection of anomalies and more efficient troubleshooting.
-
Cost-Effective Monitoring: Leveraging open-source tools reduces the need for expensive proprietary solutions, making it accessible for organizations of all sizes.
Step 1: Identify Valuable System Logs
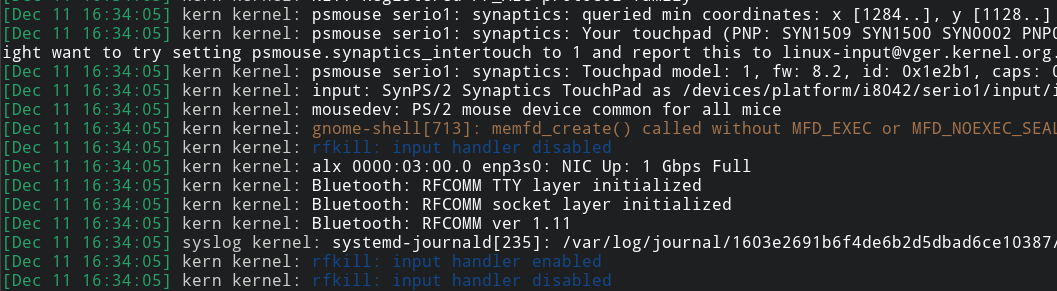
Linux systems write nearly all activity to the syslog, a centralized log file typically located at /var/log/syslog or /var/log/messages. It includes events from system services, cron jobs, authentication attempts, networking issues, package updates, and more. While syslog is designed for human-readable troubleshooting, many entries follow consistent patterns, making them suitable for extracting metrics. Converting these structured logs into metrics lets you track system behaviors over time, without needing to index and store raw logs.
Common Syslog Messages
- CRON Job Executions:
- Example:
CRON[12345]: (root) CMD (/usr/local/bin/backup.sh) - Usage: Count how often jobs run, identify failures or missed schedules.
- Example:
- Service Start/Stop Events (systemd):
- Example:
systemd[1]: Stopped nginx - Usage: Monitor service stability and uptime, alert on unexpected restarts.
- Example:
- Kernel Warnings or Networking Errors:
- Example:
kernel: TCP: too many retransmissions - Usage: Detect system-level issues like network instability, disk errors, or hardware problems.
- Example:
For our example, we will count how often CRON runs scheduled tasks, and measure how long our internal automation tool (Puppet) takes to apply a config. These are the syslog messages we'll use to define the Grok patterns needed to match lines in /var/log/syslog:
May  9 19:47:01 <host-name> CRON[843454]: (root) CMD (/usr/local/bin/health_check 2>&1|/usr/local/bin/send_to_cronspam)

May  9 19:44:17 <host-name> puppet-agent[839530]: Applied catalog in 30.74 seconds
Step 2: Define Custom Grok Patterns
Grok is a pattern-matching syntax that extracts structured fields from unstructured log lines. It works by chaining together reusable regular expression patterns with named capture groups. In Telegraf, grok_patterns allow you to match specific log formats and extract important values like usernames, durations, commands, or error codes, and turn them into time-series metrics. Let’s break down how we convert our two syslog messages into Grok patterns:
Cron Job Execution Pattern
Syslog Example:
May 9 19:47:01 <host-name> CRON[843454]: (root) CMD (/usr/local/bin/health_check 2>&1|/usr/local/bin/send_to_cronspam)
Grok Match Pattern:
"%{SYSLOGTIMESTAMP:timestamp} %{HOSTNAME:host} %{WORD:program}(?:\\[%{NUMBER:pid:int}\\])?: %{GREEDYDATA:message}"
This flexible catch-all pattern matches a wide variety of standard syslog messages. Each Grok component matches a known log structure and assigns it to a named field:
- %{SYSLOGTIMESTAMP:timestamp} => Matches May 9 19:47:01
- %{HOSTNAME:host} => Matches <host-name>
- %{WORD:program} => Matches CRON
- %{NUMBER:pid:int} => Extracts the numeric process ID (843454)
- %{GREEDYDATA:message} => Captures the entire command being executed
This line gets parsed by the catch-all and ultimately sends an incrementing count = 1 metric, allowing you to track how often scheduled tasks run.
Puppet Agent Duration Pattern
Syslog Example:
May 9 19:44:17 <host-name> puppet-agent[839530]: Applied catalog in 30.74 seconds
Specific Grok Pattern:
"%{SYSLOGTIMESTAMP:timestamp} %{HOSTNAME:host} puppet-agent\\[%{NUMBER:pid:int}\\]: Applied catalog in %{NUMBER:duration:float} seconds"
This more specific Grok rule matches only Puppet catalog application logs and captures the runtime as a numeric field. Grok patterns are also evaluated top-down, so more specific ones will come last to avoid being overridden by the catch-all:
- duration => Parsed as a floating-point number (30.74)
This field becomes a duration metric in Telegraf, which you can graph to monitor Puppet run performance over time.
Step 3: Configure Telegraf to Process Logs
If you don't already have an instance of Telegraf running on your OS, install our handy HG-CLI tool to get Telegraf up and running quickly:
curl -s "https://www.hostedgraphite.com/scripts/hg-cli/installer/" | sudo sh
Once the tool is installed, just run it in TUI mode (hg-cli tui), enter your HG API Key, and follow the prompts to install the Telegraf agent.
Now, open your Telegraf configuration file at: /etc/telegraf/telegraf.conf and add the following:
[[inputs.tail]]
  name_override = "syslog-to-telegraf"
  files = ["/var/log/syslog"]
  from_beginning = true
  watch_method = "inotify"
  path_tag = ""
  data_format = "grok"
  grok_patterns = [
    "%{SYSLOGTIMESTAMP:timestamp} %{HOSTNAME:host} %{WORD:program}(?:\\[%{NUMBER:pid:int}\\])?: %{GREEDYDATA:message}",
    "%{SYSLOGTIMESTAMP:timestamp} %{HOSTNAME:host} puppet-agent\\[%{NUMBER:pid:int}\\]: Applied catalog in %{NUMBER:duration:float} seconds"
  ]
  fieldexclude = ["remainder", "timestamp", "pid"]

[[processors.starlark]]
  namepass = ["syslog-to-telegraf"]
  source = '''
def apply(metric):
    metric.fields["count"] = 1
    return metric
'''

## Optional:
## Uncomment these outputs to print metrics to stdout for debugging and Graphite format preview

#[[outputs.file]]
#  files = ["stdout"]

#[[outputs.file]]
#  data_format = "graphite"
#  templates = [
#    "host.measurement.field"
#  ]
#  files = ["stdout"]
There's a lot going on here, so let's break down what these plugins are doing to convert log lines into time-series metrics:
[[inputs.tail]]
What it does:
- This plugin watches your syslog file (/var/log/syslog) in real time and reads new lines as they’re written, like a live feed of system activity.
Key settings:
- initial_read_offset = 'beginning': On first run, start at the top of the file (good for testing).
- data_format = "grok": Each line is parsed using the Grok patterns defined above.
- name_override = "syslog-to-telegraf": All metrics will use this name as a prefix.
How Grok is used here:
- The first pattern is a catch-all. It grabs common fields from most syslog lines, like the program name and full message.
- The second pattern is more specific, it targets Puppet logs and extracts how long a catalog took to apply (duration), which is stored as a float for metric tracking.
[[processors.starlark]]
What it does:
- Adds a count = 1 field to every log event Telegraf processes.
Why it's needed:
- Graphite only stores numeric fields, so adding a count lets us treat each matched log line as a metric and graph how often it occurs.
Run Telegraf
Save the file and once you restart the Telegraf service, the Tail Input Plugin will read your syslog file, extract matching patterns, and forward them as metrics to your Hosted Graphite account:
telegraf --config /etc/telegraf/telegraf.conf
NOTE: Telegraf's outputs.graphite plugin should already be configured if you installed Telegraf with our HG-CLI tool. If you don't have a MetricFire account yet, you can configure a different telegraf output to forward metrics to another data source.
Step 4: Visualize Metrics with Grafana
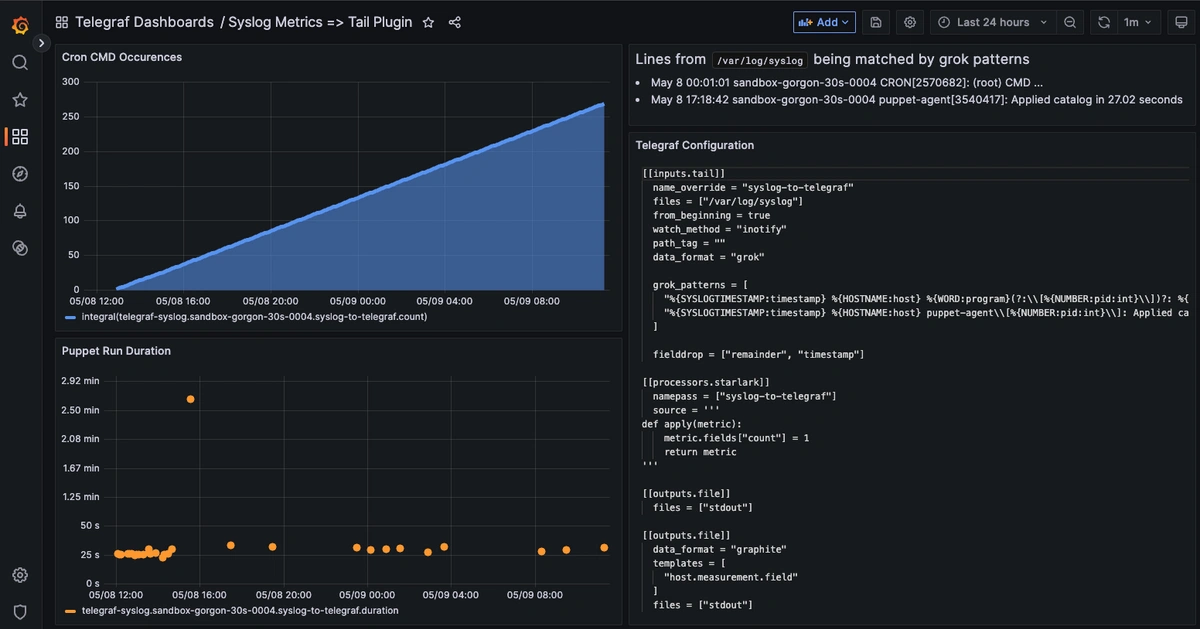
Once Telegraf is running in your OS, metrics will be forwarded to your Hosted Graphite account and can be located in the Metrics Search UI (with the *.syslog-to-telegraf.* prefix).
See our Dashboard docs on how to use these metrics to create visualizations in our Hosted Grafana. Here's an example of our two syslog lines logs as metrics:
Conclusion
Turning important log messages into metrics gives you a simple yet powerful way to track what’s happening in your system over time. Instead of digging through logs line by line, you can just glance at a graph and see how often something happens, like a CRON job running, a service restarting, or Puppet applying a config. It’s a lightweight way to get historical context, spot weird patterns early, and keep an eye on your system’s behavior without setting up a full log indexing pipeline.
Want to learn more? Reach out to us today and start a conversation. Happy monitoring!

