
Table of Contents
Great systems are not just built. They are monitored.
MetricFire is the fully managed Graphite and Grafana platform for small teams that don’t want to self-host their monitoring stack. Pre-built dashboards, alerts, and native add-ons for Heroku, AWS, Azure, and GCP. All with dedicated support and no infrastructure to maintain.
Introduction
Do you wish you could use CloudWatch, but don't want to go all-in on AWS products? There's AWS Lambda, EKS, ECS, CloudWatch and more. How much does that all cost in the end? Why do companies choose AWS when there are so many options out there? In this blog post, we're going to look at what alternatives small and medium businesses have to CloudWatch, and what each of these services can and can't do.
List of tools we will compare:
- CloudWatch
- MetricFire
- Datadog
- Dynatrace
- Prometheus (Open-Source)
- Graphite (Open-Source)
CloudWatch
Pros:
- It allows us to configure alarms to trigger a notification (like sending emails) when any specified condition is rendered satisfied.
- CloudWatch provides a feature called Events, which is different from alerts. It makes the platform aware of the application’s operational changes as they happen in real time. An Event can even automatically trigger a specified action.
- Very advanced visibility and insights about other integrated AWS services.
- Only pay for what you use.
- Centralized storage and analysis for logs and metrics from all combined AWS resources also allow executing queries on this data.
Cons:
- It can only be used for AWS services. There may be some good scripts made by third parties to get metrics for non-AWS servers but they aren't an "official" solution.
- Not enough customization of dashboards.
- No transaction tracing.
- No metrics for memory usage by default. A custom metric has to be configured in order to have this basic indicator monitored.
- Becomes very expensive at the enterprise level - and can be over $50,000 per year.
MetricFire
MetricFire provides the users with a bundled eco-system for end-to-end infrastructure monitoring consisting of the three most popular open-source monitoring services i.e. Grafana and Graphite, all in a hosted environment, and all in the same product. But that’s just not it! MetricFire boosts these services in their hosted environments with their own custom features, which renders the service more functional than original open-source projects.
For example, MetricFire improves upon vanilla Graphite by adding key components such as a built-in agent, team accounts, granular dashboard permissions, better data aggregation, and integrations to other technologies and services like AWS, Heroku, logging tools, and more. Setting up your infrastructure monitoring with Graphite has never been easier. Sign up for a free trial and get started sending metrics to MetricFire.
What makes MetricFire a competitor:
Pros of Grafana as a Service over self-hosted Grafana:
- Hundreds of pre-built dashboards tailored to each plugin.
- Easy facilitation of alerting to the customer's notification channel of choice.
- Included with all the plans offered by MetricFire, regardless of the size.
- No need to set up your own servers or data storage centers, it's all done for you in MetricFire.
Pros of MetricFire over open-source Graphite:
- Redundant storage up to 3 times - MetricFire has replaced Graphite’s antiquated file-based whisper storage with cluster-based storage for seamless scaling with multiple redundant copies of the user’s data.
- Increased support for tagged metrics - The ecosystem smoothly supports the storing and categorization of data using tags.
- Built-in API endpoints - Everything MetricFire offers is built to be automated with their APIs.
- Automatic backups for user data every hour.
- The first-line defense is provided by quality engineers and developers coupled with 24/7 on-call support.
- Designed for teams of every size, from startups to large-scale enterprises.
- 7+ years of experience in Graphite monitoring, which guarantees a matured platform with stability.
- No additional dependencies are required for installation.
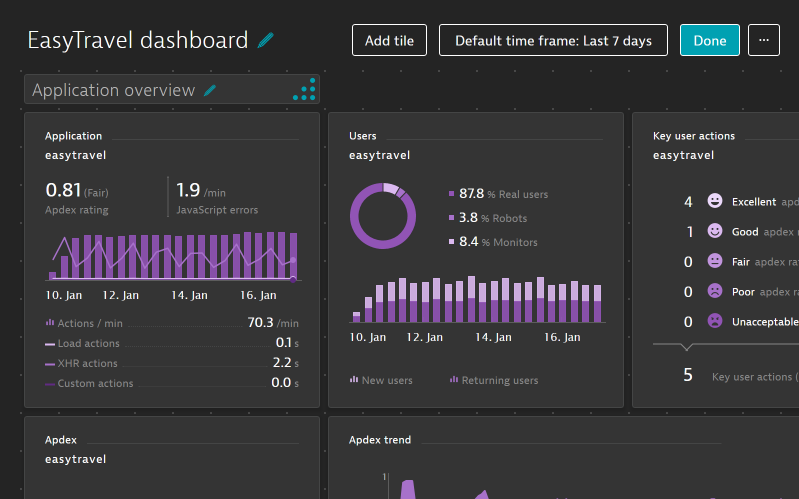
Dynatrace
Pros:
- Fairly easy installation process.
- The free version allows up to 5 servers to be monitored for an unlimited time, however, the free version doesn't include data retention. The number of visits is capped at 100k.
- Detects your deployed app’s topology and environmental changes in absolute real-time.
- Very smart at transaction tracing and process tracing.
- Your entire application topology is visualized in an interactive infographic.
Cons:
- The interface seems a bit too complex, especially for users with no experience using cloud monitoring tools.
- For small and immediate deployment infrastructures, the free version is really good. But for production-level operations, Dynatrace doesn't provide information about pricing on the site.
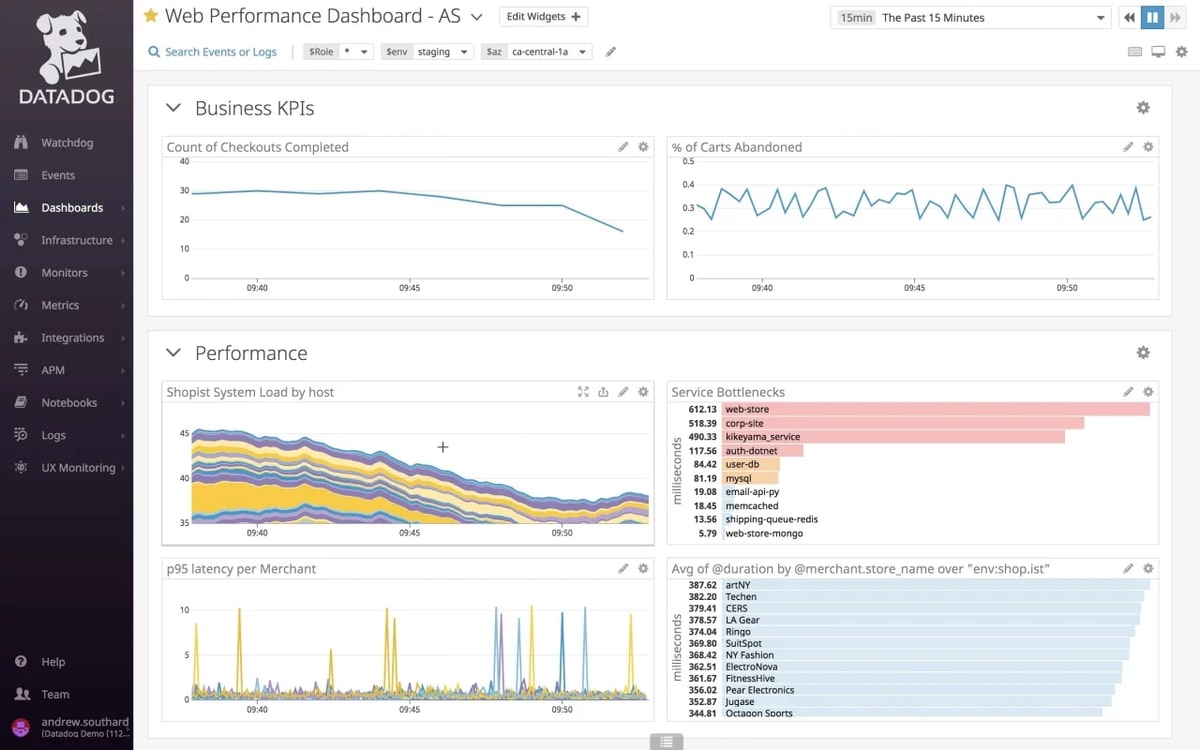
DataDog
Pros:
- Well-integrated infrastructure monitoring provides a well-balanced user experience.
- Easy one-line installation: with a quick installation (which is mostly automated) users can possess the option to easily deploy their instance across any/every host in their infrastructure.
- Auto-instrumentation for frameworks: Datadog is designed to intelligently trace requests (incoming/outgoing) from/to popular libraries, their extensions, and/or frameworks.
- Extensive customization: users can employ the API and DataDog’s existing open-source agent to collect custom information.
- Very wide coverage area: the distributed tracing capability and the platform easily supports many languages and they're actively testing even more in beta.
- Robust alerting: Datadog allows heavily customizable alerts with the capacity to apply custom functions to users' metrics and to target specific groups of resources by using straightforward tags.
Cons:
- Might take beginners in the field a bit of time to get familiar with the UI. Although the user interface is fairly nice on the first impression, it can be fairly technical to use.
- With too many applications and integrations, it can be a bit confusing to find the right dashboard.
- Datadog is a very mature product but features still seem limited and the UI is very plain.
Prometheus
Pros
- Open-source
- Provides a one-stop metric monitoring, analyzing, and querying solution.
- Works very well for recording and storing numeric time series.
- Provides extensive support for multi-dimensional data collection.
- Allows us to fine-tune the amount of RAM by requirement.
- Provides special-purpose exporters for external services and integrations like StatsD, Graphite, and HAProxy.
- Extensive support to third-party clients and libraries.
Cons
- Fails to provide 100% accuracy in terms of data being collected, refined, and ultimately presented.
- It is advised to use a different mechanism for billing and employ Prometheus just for monitoring purposes.
- Data is sometimes incomplete or insufficient.
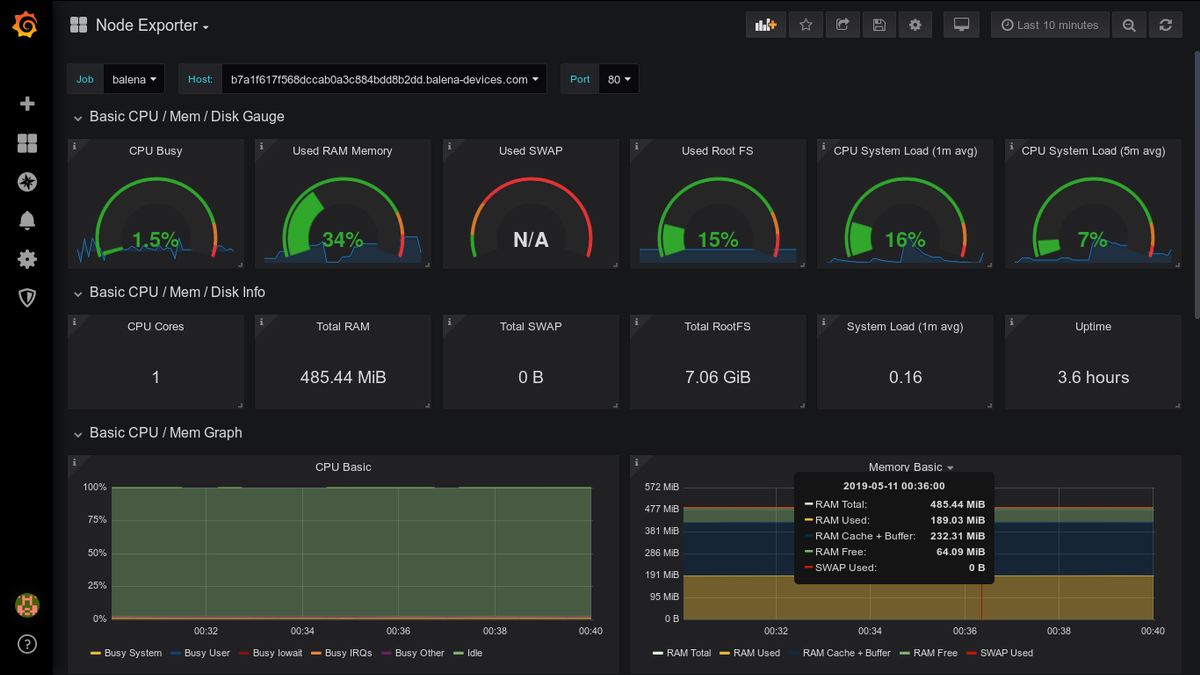
Open-Source Graphite
Pros
- Stores information in PostgreSQL or MySQL Databases, and can work with other DBs as well.
- Uses plugins to collect metrics, for example, StatsD or Collectd.
- Neat UI for querying and visualization.
- Render graphs of the collected data on demand.
- Easy third-party integrations.
Cons
- Problematic under larger loads and might require careful planning in terms of CPU and disk capacity.
- Many challenges at the time of scaling since it only handles metrics storage with rendering and doesn't record the metrics. You might need to employ other tools for recording metrics into storage.
- Not the best UI when compared to competitors like Grafana Labs.
Conclusion
CloudWatch is the most appropriate option if your stack is largely AWS. AWS services are expensive compared to competitors, but it is recommended for very large high-profile companies. Otherwise, choosing a monitoring tool will depend on the use-case it's needed for. Each tool can be leveraged depending on its audience, pricing, and ultimate application.
Get onto the MetricFire free trial today and start monitoring immediately. If you're interested in finding out how MetricFire can help with your monitoring needs, book a demo and talk to us directly.


