
Table of Contents
Great systems are not just built. They are monitored.
MetricFire runs Graphite and Grafana as a fully managed service for growing engineering teams, taking care of storage, scaling, and version updates so your team doesn't have to. Plans start at $19/month, billed per metric namespace rather than per host, and include engineer-staffed support. Integrations work natively with Heroku, AWS, Azure, and GCP, and data is stored with 3× redundancy in SOC2- and ISO:27001-certified data centres.
Hosted Graphite Goes Beyond the Open Source Graphite
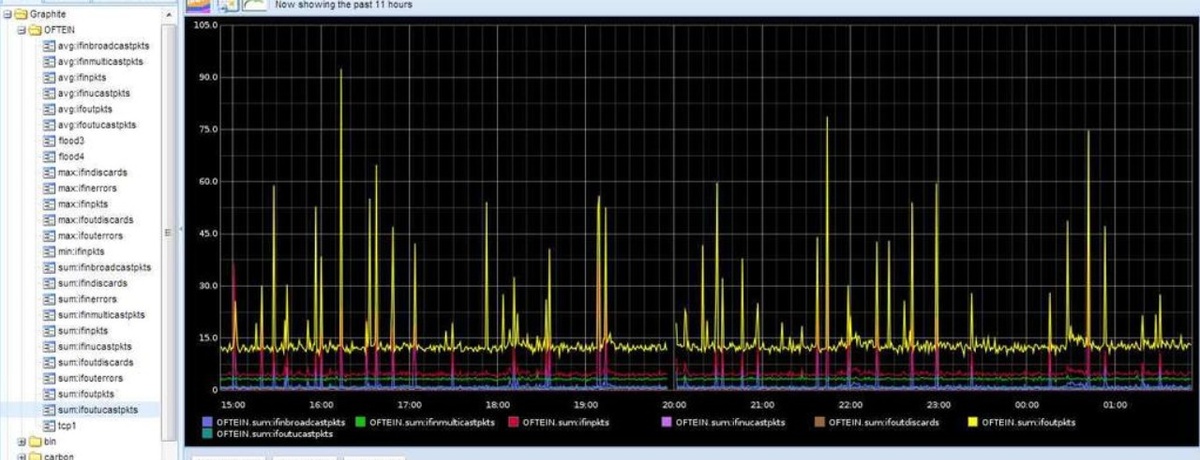
Time series data enables us to measure change. We can analyze the past, predict the future, and monitor the present. In this article, we are going to focus on the tool named Hosted Graphite and the APIs it has for connecting to external services.
Get started by signing up for our Hosted Graphite free trial. MetricFire's monitoring platform runs Hosted Graphite and Grafana. You can get metrics loaded into Hosted Graphite within a few minutes and start using the APIs today.
Hosted Graphite
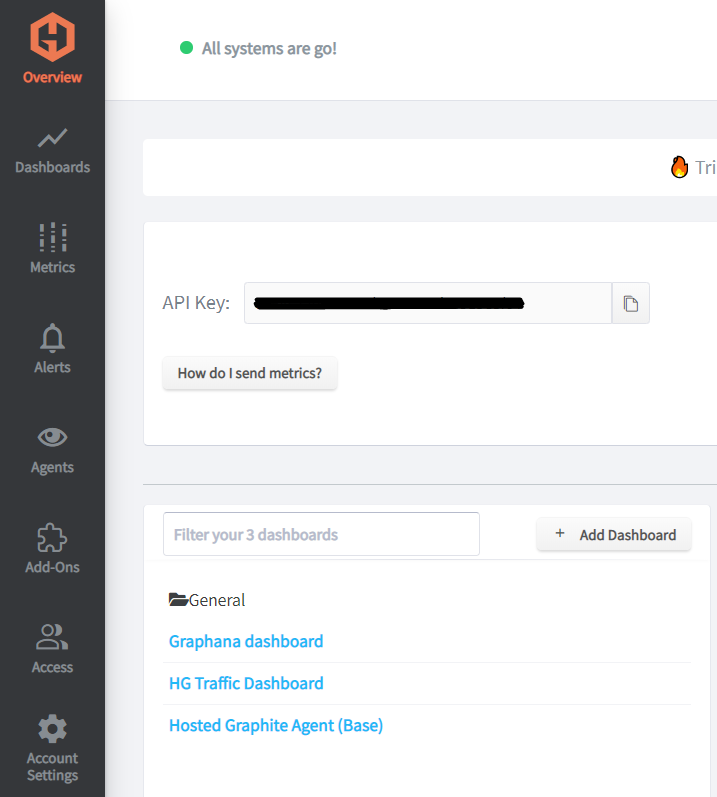
The UI of Hosted Graphite provides easy access to all its functions. You can see several tabs on the left of the window and for most tabs, there is a corresponding API with the same functions:
- Dashboards - Grafana, Render, Render Variables API;
- Metrics - Metrics, Tags API;
- Alerts - Alerts API;
- etc.
If you click these tabs you’ll find out the expanded list of features:
- Agents tab: for one simple way to collect your metrics and load them into Hosted Graphite
- Grafana and Graphite dashboards tab: for displaying and monitoring your metrics
- Metrics tab: for searching metrics and getting a quick look at the loaded metrics
- Alerts tab: for quick notifications when certain criteria are met
- Add-ons tab: for other features like add-ons for annotation, logging, hosting, and more alerting services
- Settings tab: for your team and account
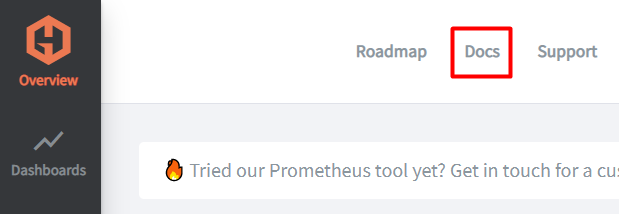
As for accessing more information about the API from the UI, you can click the ‘Docs’ button in the top right bar and go to API Guides or use the link provided here.
Hosted Graphite Features
Hosted Graphite is similar to vanilla Graphite, but there are a few exceptions:
- With Hosted Graphite, data aggregation is automatic and you don’t need to use any additional services, such as StatsD
- You don’t need to worry about old data at a certain timestamp being overwritten, as the new data will be incorporated into the data views instead
- Alerting is built-in, and Hosted Graphite integrates with many popular services, such as AWS, Azure, Heroku, Slack, and GitHub
There are also advantages of using Hosted Graphite, like built-in alerting with multiple output services, as well as offloading all of the work for maintaining your Graphite installation to the MetricFire team.
If you want to understand more about the differences and features of Hosted Graphite over Open Source Graphite check out this article.
Hosted Graphite API
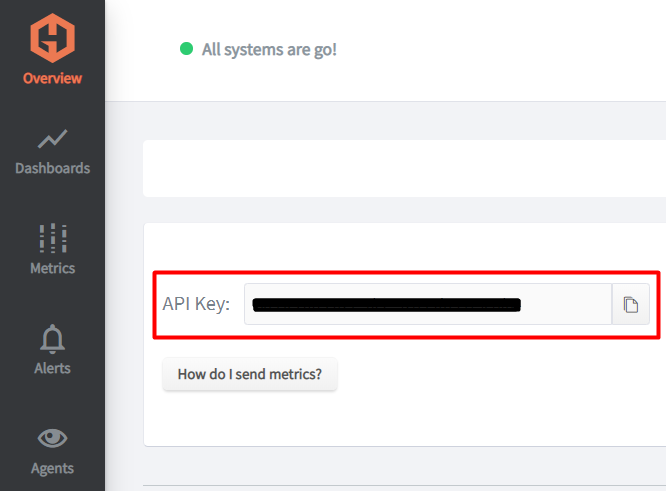
Hosted Graphite has extensive APIs to allow you to build your own integrations. To use the APIs you need the API Key which is located on the main page of Hosted Graphite:
You can read more about APIs on the Hosted Graphite documentation, but here are their short descriptions and examples:
- Metrics and Tags API are both designed for searching metrics by various filters. Here’s an example search where we find all metrics with names that end with “.limit”. We could make a curl request like this:
Request:
curl -X GET "https://YOUR-API-KEY@api.hostedgraphite.com/api/v1/metric/search?pattern=*.limit"

Response:
{
 "results": [
        "_hg_meta.traffic.datapoints.limit",
        "_hg_meta.traffic.concurrent_metrics.limit"
],
 "total_metrics": 353,
 "metrics_matched": 2
}
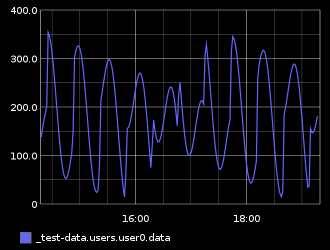
- Render API is a way to query data saved in Hosted Graphite. You can apply the functions to metric data, filter by specific time frames, and retrieve data in different kinds of graphs to use them in external services.
For this one, an API key won’t be enough. You will need to obtain an Access Key for your Hosted Grafana dashboard which can be created on this page.
We could render a graph called ‘_test-data.users.user0.data’ with data for the last 5 hours like this:
Request:
https://www.hostedgraphite.com/YOUR-UID/<Access_Key>/graphite/render?target=_test-data.users.user0.data&from=now-5h
Response:
- Render Variables API allows you to use variables as placeholders to dynamically build your queries. Let’s create a simple variable ‘user’ which will have the name ‘user0’. We will need a json file with values ‘values.json’ which looks like this:
{
  "values": [
    "user1"
    ]
}
Now let’s create the variable with a ‘curl’ request:
Request:
curl -X GET "https:/YOUR-API-KEY@api.hostedgraphite.com/v1/variables/?query="
Response:
{"variables": [{"url": "/v1/variables/user/", "name": "user"}]}
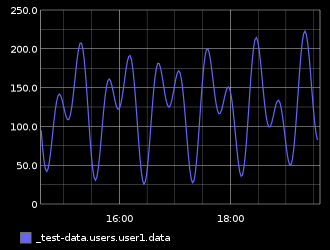
Finally, we can render a graph using our variable <user> and Render API:
Request: https://www.hostedgraphite.com/YOUR-UID/<Access_Key>/graphite/render?target=_test-data.users.<user>.data&from=now-5h
Response:
- Grafana API - allows you to fetch, create and update your Grafana dashboards. Fully supports all endpoints from Grafana documentation.
For creating a new dashboard we will need a json file ‘dashboard.json’ which looks like this:
{
"title": "Test dashboard",
"tags": [ "test" ],
"timezone": "browser",
"panels": [
    {
    }
],
"schemaVersion": 6,
"version": 0
}
Then we can make a request to create this dashboard:
curl -X POST https://YOUR-API-KEY@api.hostedgraphite.com/api/v2/grafana/dashboards/ -d @dashboard.json
Response:
{"id":4,"slug":"test-dashboard","status":"success","uid":"Rbi83AlWz","url":"/5ed6f659/grafana/d/Rbi83AlWz/test-dashboard","version":1}
Now we can add panels to this dashboard either via Grafana UI or by API.
- Annotations API provides an interface to create simple events with tags - such as when you deploy code or run tests.
This one will create an annotation called ‘Event Received’ with an ‘event’ tag which will be triggered when an event is received:
Request:
curl -X POST https://YOUR-API-KEY@api.hostedgraphite.com/api/v1/annotations/events/ -d "&title=Event Received&tag=event"
- Aggregates API offers the ability to automatically combine data points from multiple input metrics into a smaller set of output metrics according to the defined rules.
Next, curl request will create a new aggregation which combines response code metrics from all servers under a new name: ‘servers.all.requests.<response_code>’:
Request:
curl -H "Content-Type: application/json" -X POST -d '{"pattern": "servers.*.requests.<response_code>", "output": "servers.all.requests.<response_code>"}' "https://YOUR-API-CODE@api.hostedgraphite.com/v1/aggregates/"
Response:
{"url": "/v1/aggregates/452d1c0324b2445b5b5e33c4cd35caa6/", "id": "452d1c0324b2445b5b5e33c4cd35caa6"}
- Alerting API is used to deal with one of the distinct features of Hosted Graphite - Alerting. It allows us to create, read, update, delete alerts, and define scheduled mute periods.
Here’s how you could use Alerts API. In this example, using a curl request we create a new alert that triggers when the value of ‘concurrent-requests’ is above 100 for 1 minute.
Request:
curl -H "Content-Type: application/json" -X POST -d '{"name": "con-requests-max", "metric": "concurrent-requests", "alert_criteria": {"type": "above", "above_value": 100, "time_period": 1}}' "https://YOUR-API-KEY@api.hostedgraphite.com/v2/alerts/"
Response:
{"url": "/v2/alerts/8044d41d-c8c7-49f1-95eb-273eb7f77641/", "id": "8044d41d-c8c7-49f1-95eb-273eb7f77641"}
Summary
When deciding between the open-source Graphite Web and paid Hosted Graphite, remember that Hosted Graphite takes care of major problems for you and provides extensive customer support. So, with an open-source Graphite, you will spend money on your own development and support team. Keep this in mind when making your choice.
In this article, we reviewed examples of how to deal with requests for each of the Hosted Graphite APIs. The usage of APIs allows connecting the external services, making it easier to build integrations and data pipelines. So you can connect your own integration and use it with Hosted Graphite. The APIs are easy to use, all you need is an API key and sometimes an Access Key. As for testing, most requests can be easily tested even with browsers.
Sign up for the hosted graphite free trial, and send and visualize metrics directly in the platform. You can experiment with the APIs and apply what you learned from this article. Also, feel free to book a demo if you want to talk to us directly about your monitoring needs.