
Table of Contents
- Introduction
- Key Takeaways
- Introduction to Kafka
- Kafka Architecture
- Introduction to Prometheus
- Setting up Kafka monitoring using Prometheus
- Using JMX exporter to expose JMX metrics
- Setting up the Dockerfile, configuring Prometheus.yml, and running the instances
- Plotting the monitoring visualization on Grafana
- Setting up the Monitoring through MetricFire
- Conclusion
Great systems are not just built. They are monitored.
MetricFire is the fully managed Graphite and Grafana platform for small teams that don’t want to self-host their monitoring stack. Pre-built dashboards, alerts, and native add-ons for Heroku, AWS, Azure, and GCP. All with dedicated support and no infrastructure to maintain.

Introduction
In this article, we are going to discuss how to set up Kafka monitoring using Prometheus. Kafka is one of the most widely used streaming platforms, and Prometheus is a popular way to monitor Kafka. We will use Prometheus to pull metrics from Kafka and then visualize the important metrics on a Grafana dashboard. We will also look at some of the challenges of running a self-hosted Prometheus and Grafana instance versus the Hosted Grafana offered by MetricFire.
To get started, sign on to the MetricFire free trial. You can use Grafana directly on the MetricFire platform, and try out what you learn in this article.
Key Takeaways
- Kafka is a widely used streaming platform with high availability and scalability, but it lacks robust monitoring tools by default. Monitoring is crucial to catch issues in production before they lead to system failures.
- Prometheus is an open-source monitoring tool developed by SoundCloud.
- Kafka extensively uses JMX technology to expose internal metrics.
- After configuring Kafka JMX metrics for Prometheus, the article demonstrates how to visualize the data in Grafana.
- The provided Grafana dashboards display various Kafka metrics, including CPU usage, JVM memory usage, time spent in garbage collection, message and byte counts per topic, and more.
Introduction to Kafka
Kafka is the most widely used streaming technology built by Confluent. What makes Kafka good is its very seamless high availability and scalability. At the same time, the out-of-the-box installation of Kafka comes with very basic command line monitoring tools. It is very important to monitor the health of Kafka in production deployments so that if your Kafka is trending in a negative direction, then you can catch the issues before it suddenly falls over.
Kafka Architecture
Kafka is a distributed streaming platform. Primarily, Kafka's architecture consists of:
- Topics - A topic is a logical entity on which records are published. A topic consists of the number of partitions. Each record within a topic is assigned a partition along with an incrementing offset.
- Producers - Producers publish data on the topic. Producers can either provide the partition number to which the record is to be published or a hash key that Kafka will consistently use to distribute the data to multiple topics.
- Consumers - Consumers read data from the topic. Consumers can be distributed across multiple machines. Each consumer is identified with a consumer group.
Kafka uses Zookeeper to store its configuration and metadata. To find out more details about Kafka, refer to the official documentation.
Introduction to Prometheus
Prometheus is an open-source alerting and monitoring tool developed by SoundCloud in 2012. We are not going to explain the basics of Prometheus in this article in detail. For introductions to Prometheus, please refer to our articles below:
Monitoring a Python web app with Prometheus
Monitoring Kubernetes tutorial: using Grafana and Prometheus
Setting up Kafka monitoring using Prometheus
We will use docker to set up a test environment for Kafka, Zookeeper, Prometheus, and Grafana. We will use the docker images available at:
https://hub.docker.com/r/grafana/grafana/
https://hub.docker.com/r/prom/prometheus/
For tutorials on how to set up Prometheus and Grafana with Docker, check out our articles on How to Deploy Prometheus on Kubernetes, and Connecting Prometheus and Grafana where both articles show different methods to set up a test environment with Docker.
Using JMX exporter to expose JMX metrics
Java Management Extensions (JMX) is a technology that provides the tools for providing monitoring within applications built on JVM.
Since Kafka is written in Java, it extensively uses JMX technology to expose its internal metrics over the JMX platform.
JMX Exporter is a collector that can run as a part of an existing Java application (such as Kafka) and expose its JMX metrics over an HTTP endpoint, which can be consumed by any system such as Prometheus. For more information about Prometheus exporters, here is our article that deep dives into how Prometheus exporters work.
See our related article HERE, for detailed instructions on how to use OpenTelemetry to scrape metrics from the JMX prometheus Exporter Agent, and monitor the performance of your Java application.
Setting up the Dockerfile, configuring Prometheus.yml, and running the instances
As a first step, we will build a Kafka docker image, which will include the JMX exporter instance running as part of the Kafka instance.
The configuration file prom-JMX-agent-config.yml is available here:
lowercaseOutputName: true
rules:
- pattern : kafka.cluster<type=(.+), name=(.+), topic=(.+), partition=(.+)><>Value
  name: kafka_cluster_$1_$2
  labels:
    topic: "$3"
    partition: "$4"
- pattern : kafka.log<type=Log, name=(.+), topic=(.+), partition=(.+)><>Value
  name: kafka_log_$1
  labels:
    topic: "$2"
    partition: "$3"
- pattern : kafka.controller<type=(.+), name=(.+)><>(Count|Value)
  name: kafka_controller_$1_$2
- pattern : kafka.network<type=(.+), name=(.+)><>Value
  name: kafka_network_$1_$2
- pattern : kafka.network<type=(.+), name=(.+)PerSec, request=(.+)><>Count
  name: kafka_network_$1_$2_total
  labels:
    request: "$3"
- pattern : kafka.network<type=(.+), name=(\w+), networkProcessor=(.+)><>Count
  name: kafka_network_$1_$2
  labels:
    request: "$3"
  type: COUNTER
- pattern : kafka.network<type=(.+), name=(\w+), request=(\w+)><>Count
  name: kafka_network_$1_$2
  labels:
    request: "$3"
- pattern : kafka.network<type=(.+), name=(\w+)><>Count
  name: kafka_network_$1_$2
- pattern : kafka.server<type=(.+), name=(.+)PerSec\w*, topic=(.+)><>Count
  name: kafka_server_$1_$2_total
  labels:
    topic: "$3"
- pattern : kafka.server<type=(.+), name=(.+)PerSec\w*><>Count
  name: kafka_server_$1_$2_total
  type: COUNTER

- pattern : kafka.server<type=(.+), name=(.+), clientId=(.+), topic=(.+), partition=(.*)><>(Count|Value)
  name: kafka_server_$1_$2
  labels:
    clientId: "$3"
    topic: "$4"
    partition: "$5"
- pattern : kafka.server<type=(.+), name=(.+), topic=(.+), partition=(.*)><>(Count|Value)
  name: kafka_server_$1_$2
  labels:
    topic: "$3"
    partition: "$4"
- pattern : kafka.server<type=(.+), name=(.+), topic=(.+)><>(Count|Value)
  name: kafka_server_$1_$2
  labels:
    topic: "$3"
  type: COUNTER

- pattern : kafka.server<type=(.+), name=(.+), clientId=(.+), brokerHost=(.+), brokerPort=(.+)><>(Count|Value)
  name: kafka_server_$1_$2
  labels:
    clientId: "$3"
    broker: "$4:$5"
- pattern : kafka.server<type=(.+), name=(.+), clientId=(.+)><>(Count|Value)
  name: kafka_server_$1_$2
  labels:
    clientId: "$3"
- pattern : kafka.server<type=(.+), name=(.+)><>(Count|Value)
  name: kafka_server_$1_$2

- pattern : kafka.(\w+)<type=(.+), name=(.+)PerSec\w*><>Count
  name: kafka_$1_$2_$3_total
- pattern : kafka.(\w+)<type=(.+), name=(.+)PerSec\w*, topic=(.+)><>Count
  name: kafka_$1_$2_$3_total
  labels:
    topic: "$4"
  type: COUNTER
- pattern : kafka.(\w+)<type=(.+), name=(.+)PerSec\w*, topic=(.+), partition=(.+)><>Count
  name: kafka_$1_$2_$3_total
  labels:
    topic: "$4"
    partition: "$5"
  type: COUNTER
- pattern : kafka.(\w+)<type=(.+), name=(.+)><>(Count|Value)
  name: kafka_$1_$2_$3_$4
  type: COUNTER
- pattern : kafka.(\w+)<type=(.+), name=(.+), (\w+)=(.+)><>(Count|Value)
  name: kafka_$1_$2_$3_$6
  labels:
    "$4": "$5"
FROM wurstmeister/kafka

ADD prom-jmx-agent-config.yml /usr/app/prom-jmx-agent-config.yml
ADD https://repo1.maven.org/maven2/io/prometheus/jmx/jmx_prometheus_javaagent/0.6/jmx_prometheus_javaagent-0.6.jar /usr/app/jmx_prometheus_javaagent.jar
Once we have the above file as a Dockerfile, we can create our docker-compose.yml which would contain configurations for each of our services: Prometheus, Grafana, Zookeeper, and Kafka.
version: "3.2"
services:
 prometheus:
   image: prom/prometheus
   ports:
     - "9090:9090"
   volumes:
     - ./prometheus.yml:/etc/prometheus/prometheus.yml

 grafana:
   image: grafana/grafana
   ports:
     - "3000:3000"
   volumes:
     - ./grafana:/var/lib/grafana

 zookeeper:
   image: wurstmeister/zookeeper
   ports:
     - "2181:2181"

  kafka:
   build: .
   links:
     - zookeeper
   ports:
     - "9092:9092"
   environment:
     KAFKA_ADVERTISED_HOST_NAME: kafka
     KAFKA_ADVERTISED_PORT: 9092
     KAFKA_ZOOKEEPER_CONNECT: zookeeper:2181
     KAFKA_OPTS: -javaagent:/usr/app/jmx_prometheus_javaagent.jar=7071:/usr/app/prom-jmx-agent-config.yml
   volumes:
     - /var/run/docker.sock:/var/run/docker.sock
We will also create a default prometheus.yml file along with the docker-compose.yml. This configuration file contains all the configurations related to Prometheus. The config below is the default configuration that comes with Prometheus.
# my global config
global:
    scrape_interval:     15s # Set the scrape interval to every 15 seconds. Default is every 1 minute.
    evaluation_interval: 15s # Evaluate rules every 15 seconds. The default is every 1 minute.
# scrape_timeout is set to the global default (10s).
# Alertmanager configuration
alerting:
    alertmanagers:
    - static_configs:
    - targets:
    # - alertmanager:9093
# Load rules once and periodically evaluate them according to the global 'evaluation_interval'.
rule_files:
# - "first_rules.yml"
# - "second_rules.yml"
# A scrape configuration containing exactly one endpoint to scrape:
# Here it's Prometheus itself.
scrape_configs:
# The job name is added as a label `job=<job_name>` to any timeseries scraped from this config.
- job_name: 'kafka'
  # metrics_path defaults to '/metrics'
  # scheme defaults to 'http'.
  static_configs:
  - targets: ['kafka:7071']
Finally, we can run the “docker-compose up -d” to run our Prometheus, Grafana, Zookeeper, and Kafka instances.
Plotting the monitoring visualization on Grafana
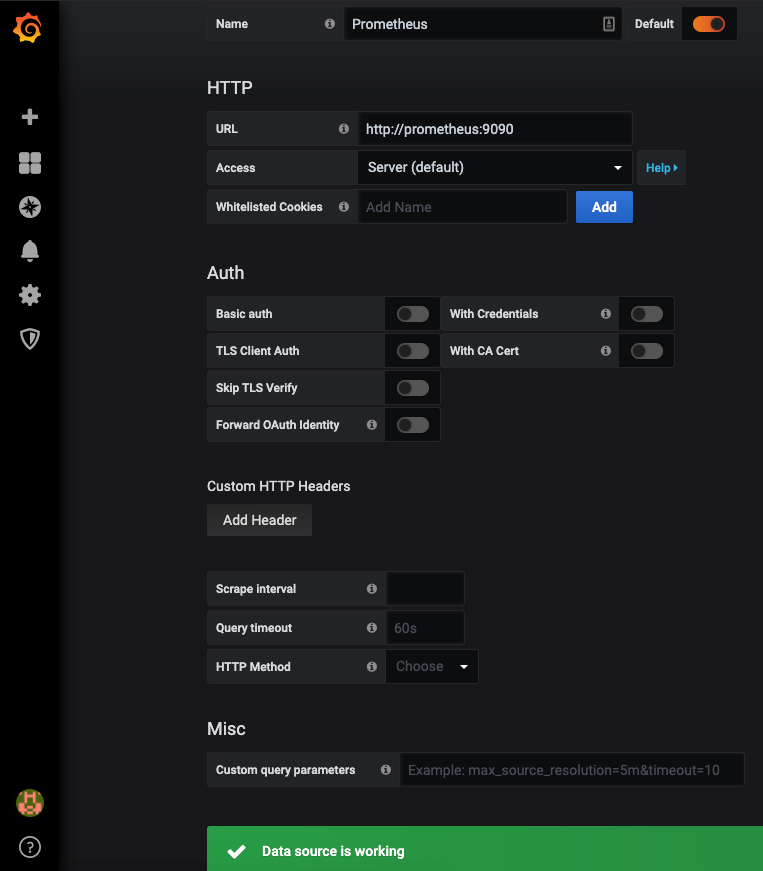
Now that we have configured Kafka JMX metrics to pipe into Prometheus, it's time to visualize it in Grafana. Browse to http://localhost:3000, log in using admin/admin, and add the data source for Prometheus as shown below. Make sure you use the data source name “Prometheus” since we will be referring to this data source name when we query in our Grafana dashboards.
One way to create a dashboard in Grafana is to manually configure the panels one by one or to kickstart our process, we can download the pre-configured dashboard from the Grafana dashboard site and import it into your Grafana.
Click on the Download JSON link download the json file and import it into our Grafana as shown below:
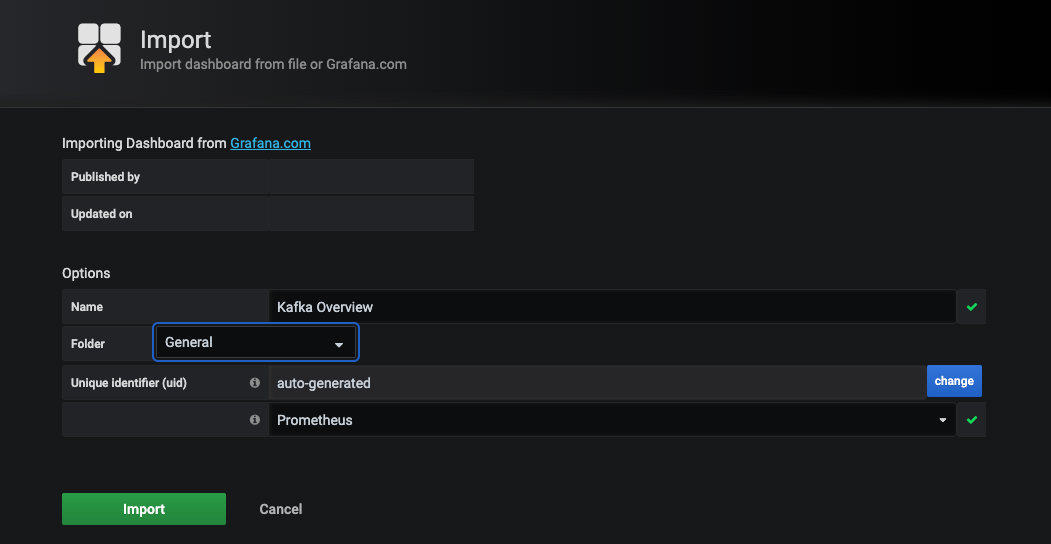
Make sure to choose the correct data source, which is “Prometheus” in our case, and click on the Import button.
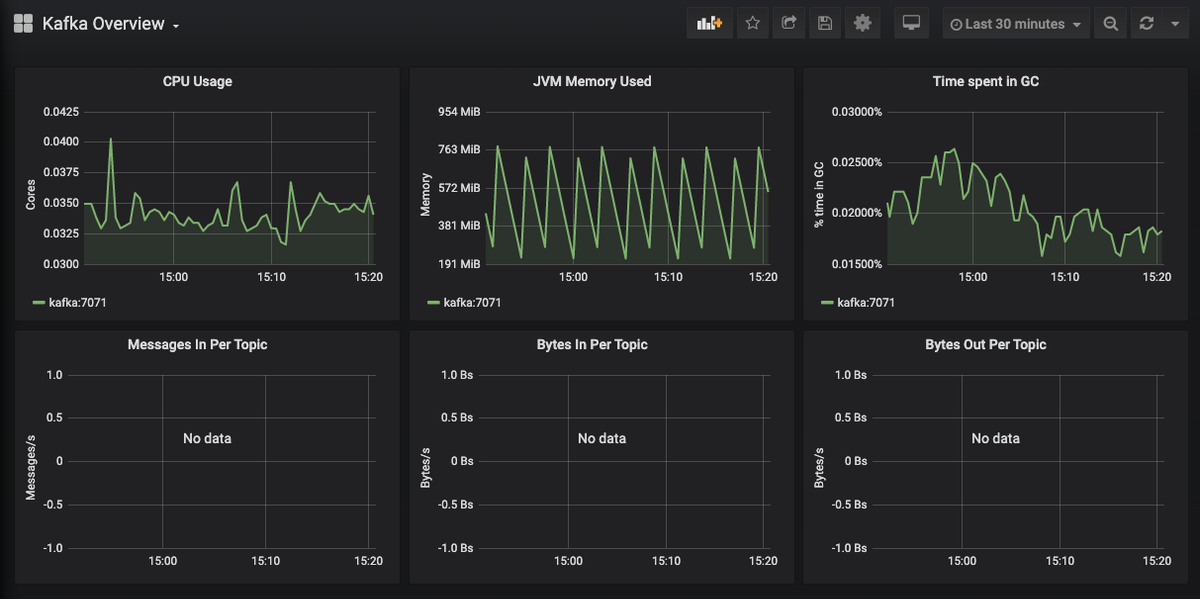
You should immediately see the dashboard reporting the following metrics from the Kafka instance:
- CPU Usage
- JVM Memory Used
- Time spent in GC
- Message in Per Topic
- Bytes In Per Topic
- Bytes Out Per Topic
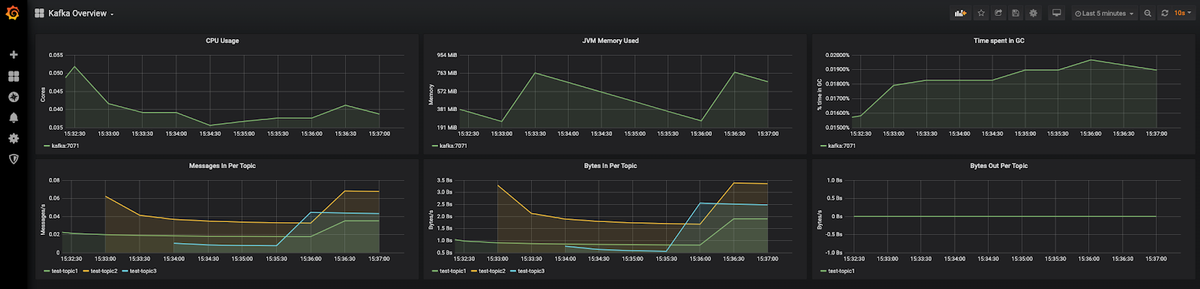
Once you have some records and messages flowing through those topics, you will be able to see the traffic details per Kafka topic as shown below:
You might want to set up alerts on these dashboards if the values in these dashboards exceed some critical threshold. Check out our article Grafana Dashboards from Basic to Advanced Dashboards to build dashboards that better suit your needs.
You can also create other types of visualizations based on the metrics exposed by Prometheus. Have a look at the article Our Favorite Grafana Dashboards to create some of the more advanced dashboards.
Let’s take a look at one dashboard that we created below. This example shows the following information:
- Total no. of messages
- Kafka Broker Iptime
- Topic BytesIn to BytesOut Rate
- Network Processor Idle Percentage
- JVM Heap Memory Usage
- JVM System CPU Load
- Request Handle Idle Percentage
- Kafka Network Request Metrics
- Total Partition Count
- Total Under Replicated


You can download the pre-configured dashboard above from this github link and import it into your Grafana.
Setting up the Monitoring through MetricFire
The setup which we have done above works for very basic Kafka infrastructure which would contain just a few topics and a moderate amount of traffic. In order to handle production level load, which would be a few hundred topics and upwards of a few Mbps network traffic, you would need to scale out Prometheus to handle the increasing load.
Hosted Graphite through MetricFire gives you many benefits such as scalability with increasing load, long-term storage of data, and continuous active deployment of new features.
Take a look at our tutorial on how to set up Graphite and Grafana through MetricFire.
Conclusion
We have seen how to set up Kafka monitoring using Prometheus. We have also seen some advanced visualizations to monitor Kafka metrics using Grafana dashboards.
Sign up here for a free trial of our Hosted Graphite Also, if you have any questions about our products, or about how MetricFire can help your company, talk to us directly by booking a demo.


