
Great systems are not just built. They are monitored.
MetricFire runs Graphite and Grafana as a fully managed service for growing engineering teams, taking care of storage, scaling, and version updates so your team doesn't have to. Plans start at $19/month, billed per metric namespace rather than per host, and include engineer-staffed support. Integrations work natively with Heroku, AWS, Azure, and GCP, and data is stored with 3× redundancy in SOC2- and ISO:27001-certified data centres.
Introduction
In this article, we'll cover our newest feature- Microsoft Teams notifications! We'll walk you through how to set it up, and we'll take a look at why we are constantly making the MetricFire experience better.
Our Newest Channel Is Here!
Monitoring is a critical part of your Infrastructure. But without proper alerting capabilities, it is not helpful.
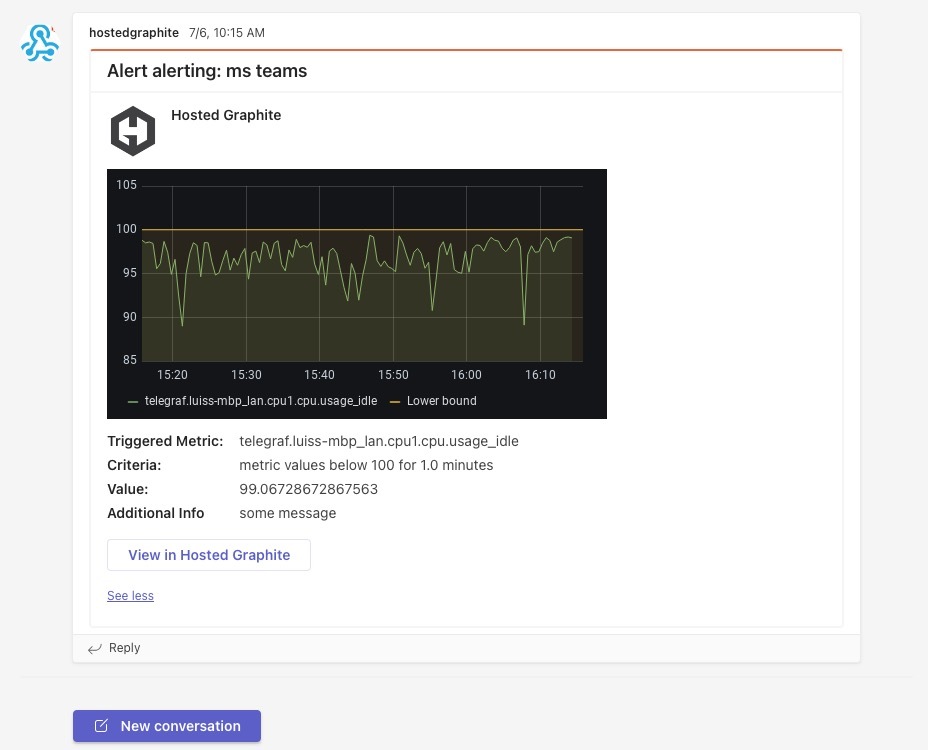
We have added a new notification channel to our collection- Microsoft Teams. Now, you can receive alerts on your metrics from your Microsoft Teams account and solve problems faster.
We'll show you how to set up Microsoft Notifications below. First, get started with a MetricFire free 14-day trial today! Once you have sent some metrics, we can begin.
Creating a Microsoft Teams Webhook
In order to create these alerts, we first have to create the endpoint for the alert. We will do so by creating a simple webhook from MS Teams.
First, we'll log into our Teams account and navigate to the channel where you will receive the alerts and notifications as shown below.
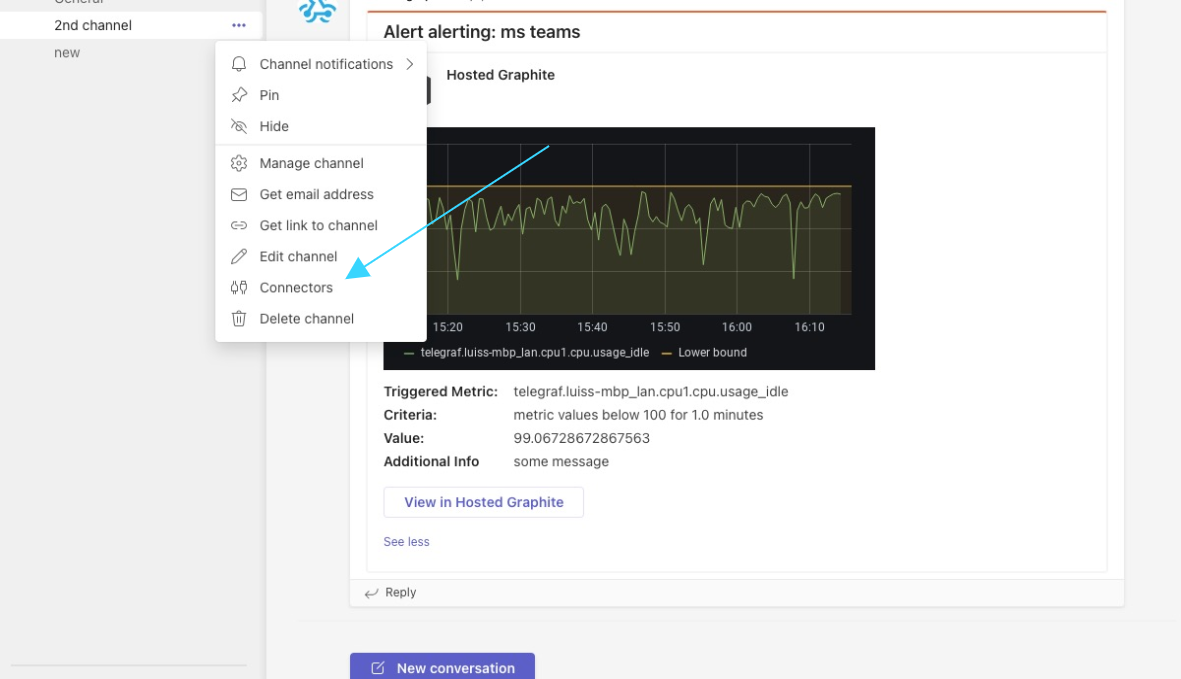
Next, we will click on the ellipsis (...) next to the desired channel name on the left. In the small menu window, click connectors to go to the configured integrations.
A new window will appear (below) and will show connected applications for your Microsoft account. Look for the "Incoming Webhook" option by scrolling down or using the search bar.
Once you have found it, click Configure.

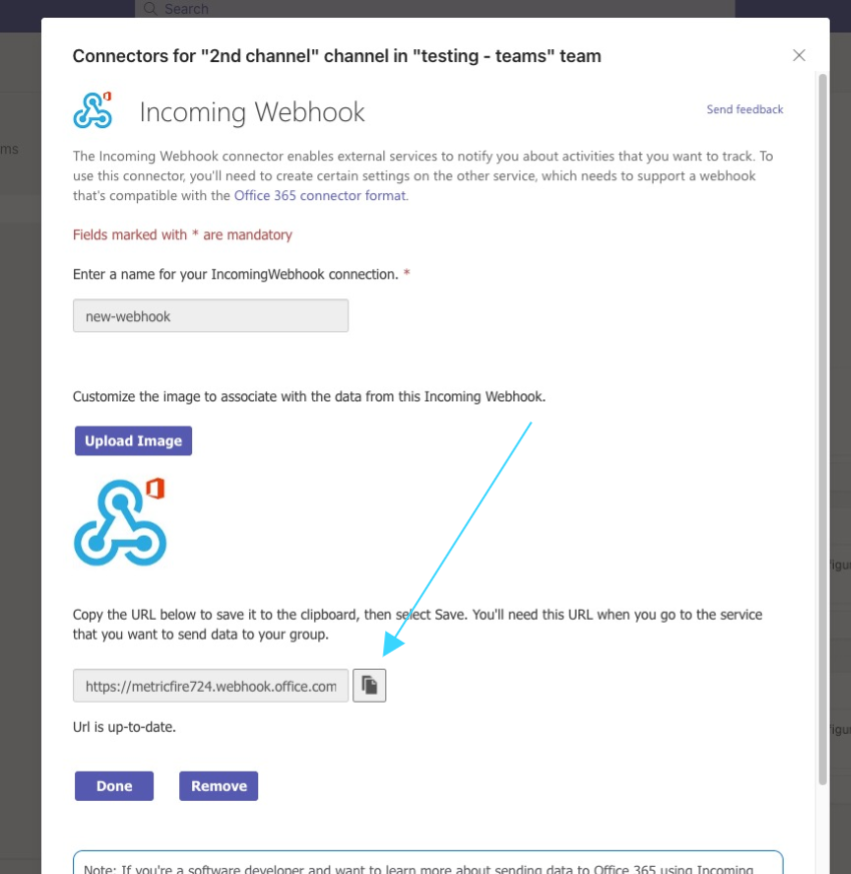
Next, add a name for your new webhook. In the screenshot below, we named this "new-webhook". You also have the option to add an image to this notification if this is important to you.
Once you have saved the name of your webhook, copy the URL, and click 'Save', then 'Done'.
Connecting Teams with MetricFire
Next, we'll go to our MetricFire account. Log in and navigate to the 'Alerts' tab on the left-hand sidebar.
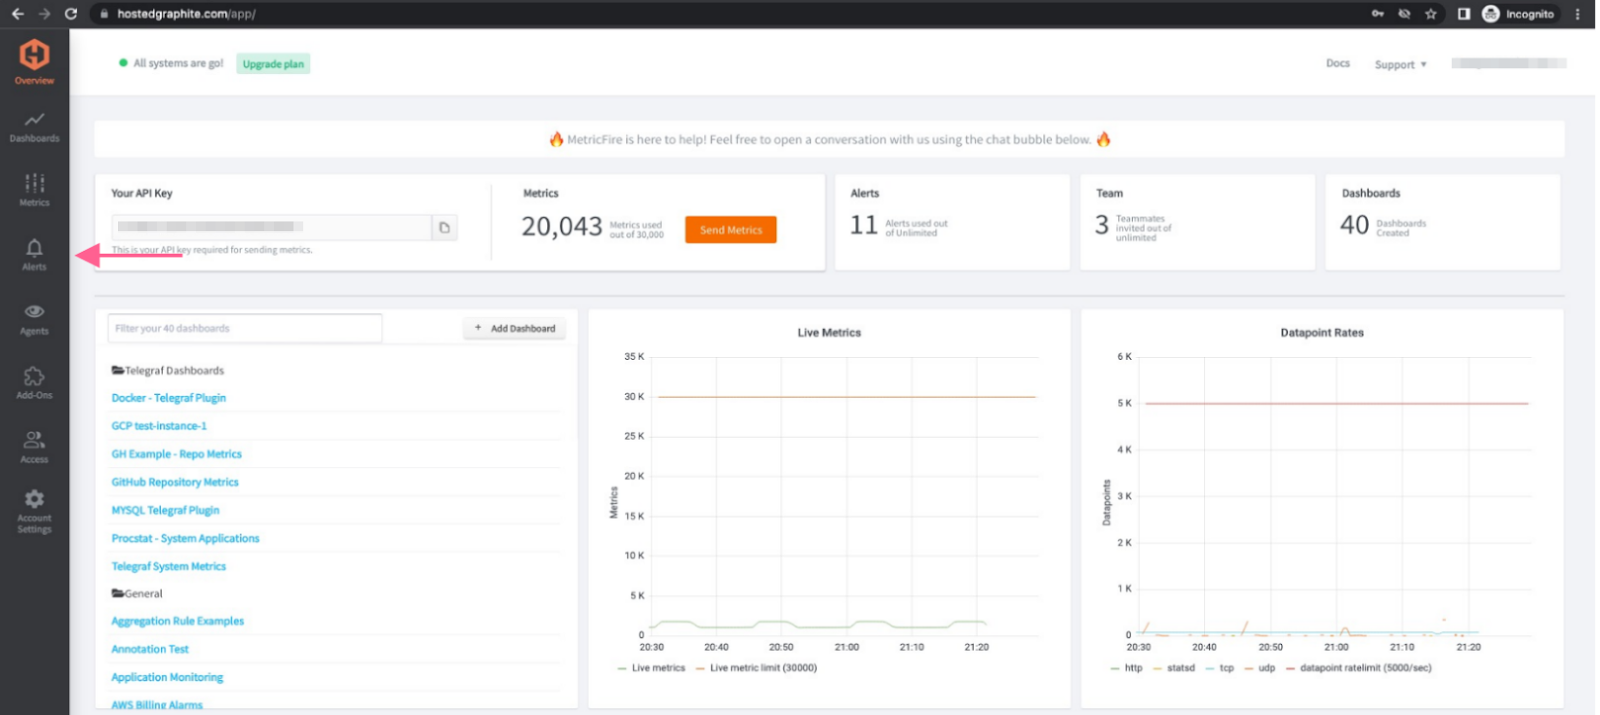
Hover over the 'Alerts tab' until you see 'Notification Channels' as seen below. Click on this tab to open the Notifications page.
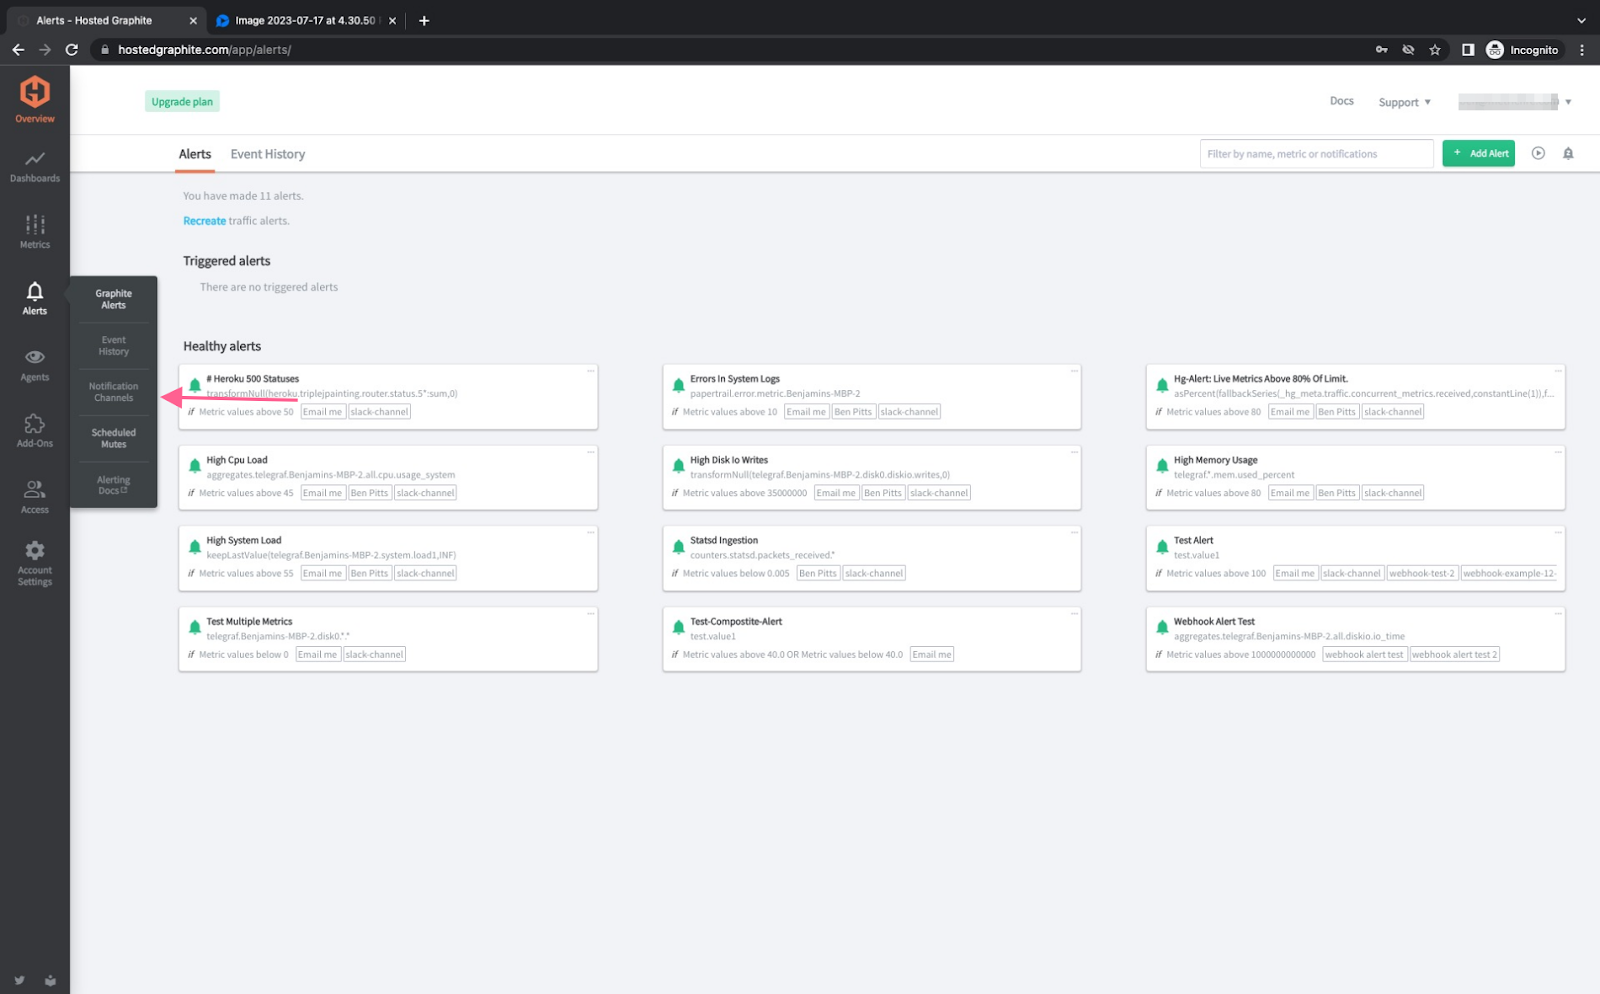
On the notification page, you can see all the active channels available, and which alerts are associated with these notifications.
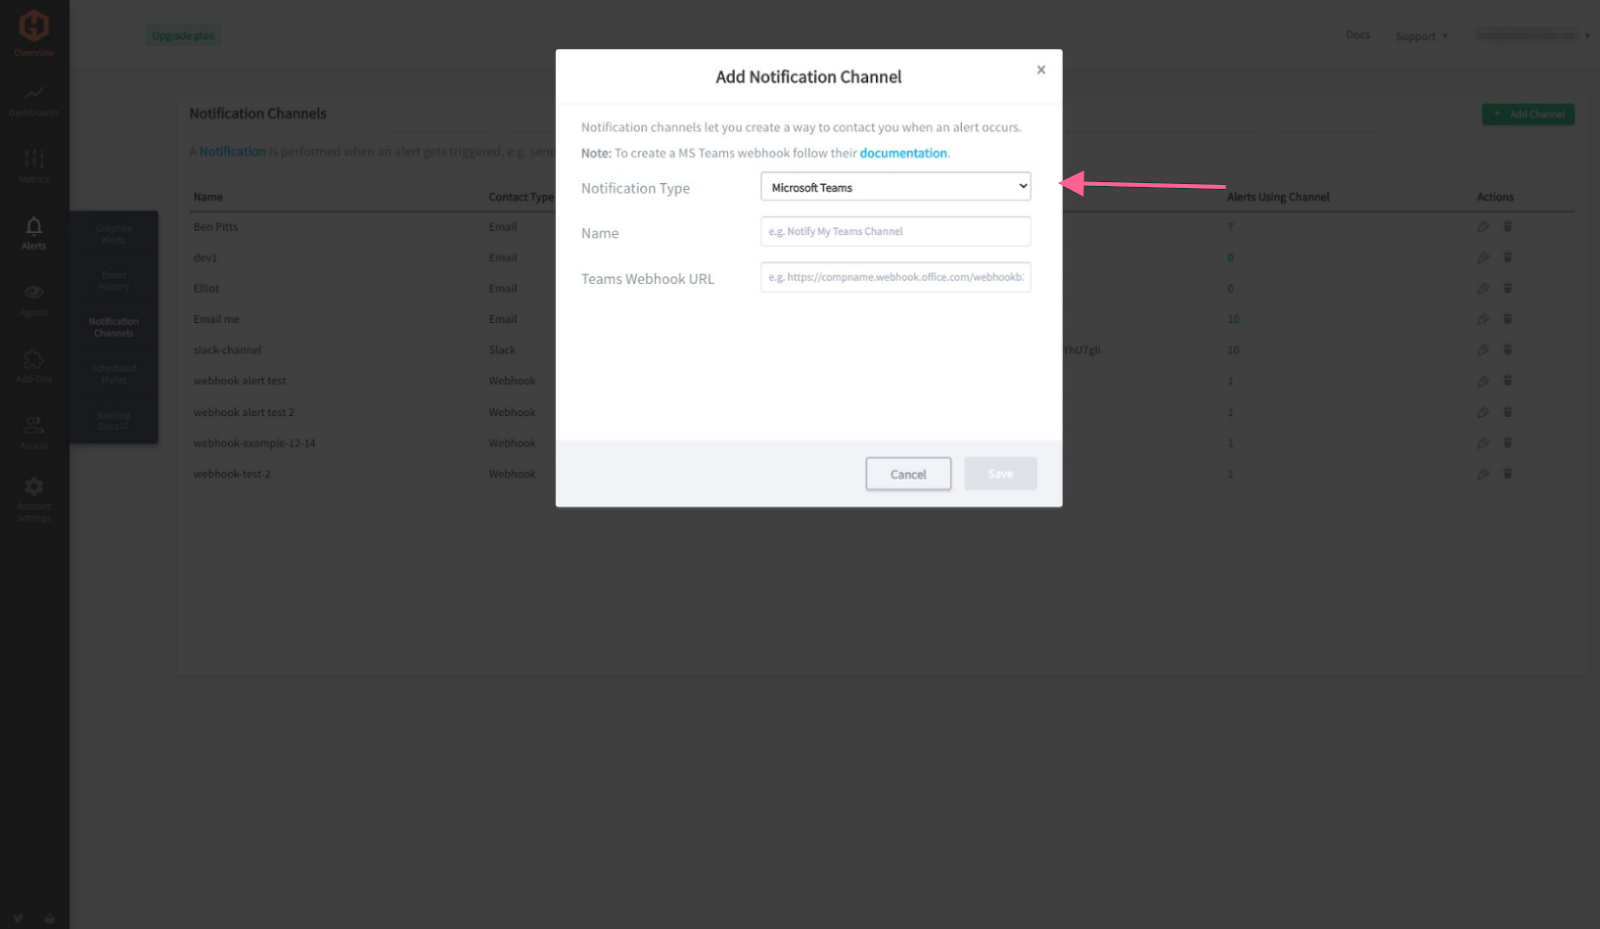
If you go to the right of the page, you will see the green button: '+ Add Channel'. Click on this to open the channel setup window.

Once this window has opened, click the dropdown. There are a variety of options, such as Slack, Pagerduty, and Email, but in this scenario, we'll select 'Microsoft Teams.'

Add the name of the channel and paste the URL we copied from Microsoft Teams. Once this is complete, click 'Save'.
And we're done! Now we can create an alert, and test the notification.
How MetricFire Can Help
Monitoring your applications and infrastructure can be an expensive pain. MetricFire is there to make your life easier. Combined with our integration capabilities, similar to how Integrate.io connects data across multiple sources for analytics and reporting, MetricFire delivers comprehensive visibility into your systems through customizable alerts and notifications.
At MetricFire, we believe that monitoring should be accessible to you. So we offer an affordable and reliable solution that frees up your developer's time without interfering with your budget or the quality of your results.
We are constantly working to improve our platform by adding new features, ensuring reliable service, and offering 24/7 support. If you are using Microsoft Teams, we're there for you.
Conclusion
In this article, we covered our latest feature. We showed you how you can set up a Teams webhook and connect with MetricFire.
We offer a tried and true monitoring solution to make your life easier. We'd love to help you get started. Sign up for a free trial today and we'll help you get started!