
Table of Contents
Great systems are not just built. They are monitored.
MetricFire runs Graphite and Grafana as a fully managed service for growing engineering teams, taking care of storage, scaling, and version updates so your team doesn't have to. Plans start at $19/month, billed per metric namespace rather than per host, and include engineer-staffed support. Integrations work natively with Heroku, AWS, Azure, and GCP, and data is stored with 3× redundancy in SOC2- and ISO:27001-certified data centres.
Data, in all its forms, is an extremely powerful and useful commodity. Data collected on an entity provides an amazing insight into the state of that entity at any given time, which in turn aids in decision making for better optimization, fault recognition/tolerance, and development of new features. This entity could be a business, a set of software applications, or even containers.
Containers have become an integral part of modern software architecture, with them being able to host databases, parts of applications, and even entire applications in a self contained environment independent of the host server. As such, properly monitoring your containers is absolutely essential to keep the applications they host, healthy and efficient.
Presently, Docker is the dominant force in the world of containers, accounting for over 83% of all containers in production in 2018. Due to its popularity, monitoring docker containers sometimes boils down to a problem of choice, as there exist a variety of tools from which to choose from, each of them having their pros and cons.
In many cases, MetricFire is a great option for monitoring your docker containers. MetricFire is a platform providing hosted versions of Graphite and Grafana. Built on these open-source tools, MetricFire provides an agile tool that is highly customizable and well known throughout the DevOps and SRE communities. Try the MetricFire free trial here, and start monitoring docker containers today.
This article aims to provide a breakdown of popular docker monitoring tools in a manner that helps you decide which one is best for your use case.
MetricFire
Built on the open-source Graphite and Grafana, MetricFire is ready to monitor docker containers with default dashboards and plugins readily available. MetricFire is fundamentally a service that provides hosted versions of open source projects, so MetricFire is able to do anything that open source projects do. This includes all of the adaptations and plugins that have been developed by the community at large.
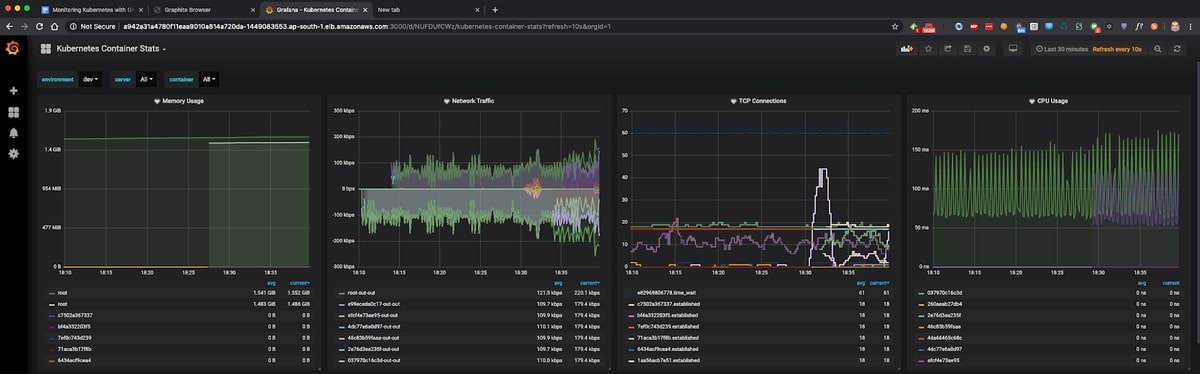
MetricFire integrates with cAdvisor, and Kubernetes, making it the ultimate tool for monitoring docker containers. The technology behind MetricFire is also in constant development, as a result of the massive community of followers behind the open source tools.
This means that if you choose MetricFire as your Docker monitoring tool, you won't have to worry about your monitoring technology falling behind as Docker and Kubernetes rapidly develop.
MetricFire has a 14-day free trial, so you can start sending your metrics asap, and see how the platform works. You should sign up for the free trial here.
Docker CLI (docker stats)
Let’s take a look at the monitoring tool provided by docker itself, the docker stats command. Running this command on the terminal returns a live data stream for running containers, providing basic metrics covering the containers’ resource consumption.
These metrics include the container ids for the various running containers present, CPU, memory and network usage. If you would want to list the metrics for a single container, instead of all your running containers, simply append the container ID for the said container to the end of the command, for example:

In the example above, I am fetching metrics for only the container with container id fb649db2dc20. I am using the --no-stream option to disable streaming stats, such that only the first result is pulled.
Running this command without that flag would cause these metrics to be polled and displayed continuously, until you manually stop the process. Other useful flags for this command can be found in the docker documentation.
However, the docker stats command does not support any form of data visualization, it simply displays the metrics as raw data in the terminal. As such, it is useful for quick glances into container health and status, but would not provide much value in a situation where detailed monitoring or visual monitoring dashboards are required. For long-term monitoring with great visualizations, we recommend Grafana.
cAdvisor
cAdvisor is an open source container monitoring tool maintained by Google. With built in support for Docker, or literally any other type of container out of the box, cAdvisor can be used to collect data on virtually any type of running container. It consists of a single running daemon that collects, processes, aggregates and exports information about running containers.
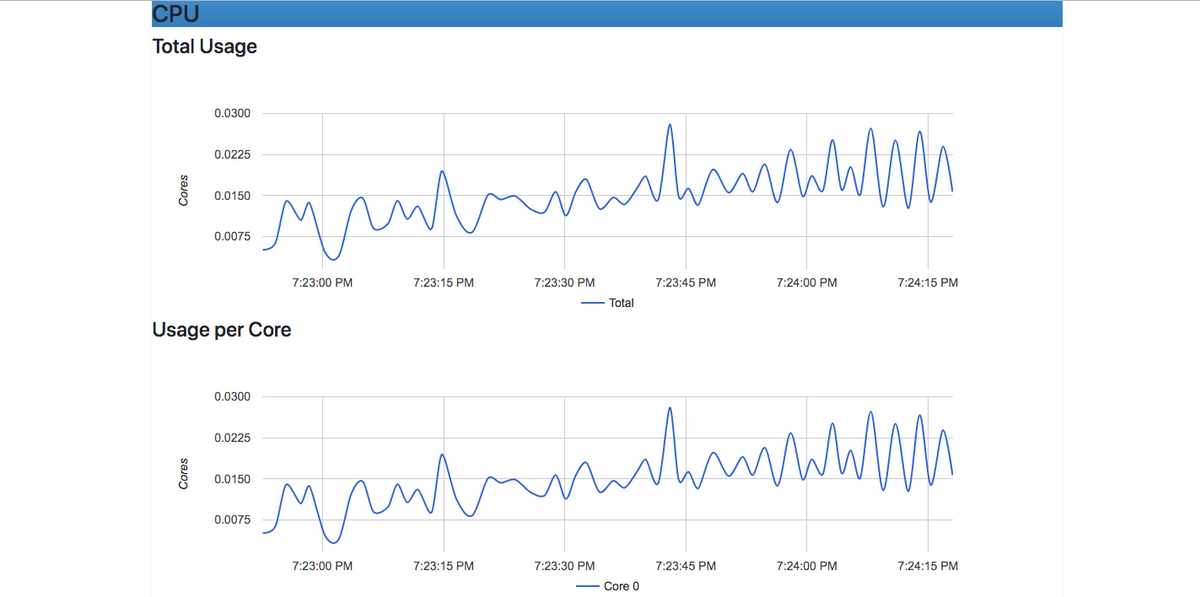
This information can either be exported and viewed from its built in user interface, or exported to a larger monitoring platform for more analysis and visualization. However, cAdvisor collects a ton of metrics on the containers it monitors, but its web user interface is fairly limited, as it only shows generic data on certain aspects of container performance, such as memory and cpu usage. You can see an example cAdvisor dashboard below:
In order to access the detailed metrics cAdvisor collects, storage plugins can be used to export these metrics to a larger monitoring or storage system, from where they can be processed. For a more in-depth look into using cAdvisor to monitor docker containers, check out this article. Also, consider integrating cAdvisor with MetricFire, which gives you the best of both worlds.
Prometheus
Prometheus is an extremely popular open source monitoring and alerting system. Unlike most monitoring tools which use a push based mechanism to collect metrics (agents on the monitored containers collect and send out their metrics), Prometheus uses a pull based mechanism (polling).
In a pull-based system containers/servers expose metric endpoints to Prometheus, then Prometheus scrapes metric data from these endpoints at configurable intervals.
Prometheus then processes and aggregates this data such that the data can be displayed using its in-built expression browser, or used to build insightful dashboards on visualization tools such as Grafana.
Prometheus offers an extensive amount of client libraries, which in combination with its polling mechanism, allow for a vast variety of client side integrations.
Basically, all you need to do to get your metrics into Prometheus is to define and expose those metrics using an HTTP endpoint on your application’s instance, using the appropriate client library for your application code (metrics created using client libraries are called custom metrics).
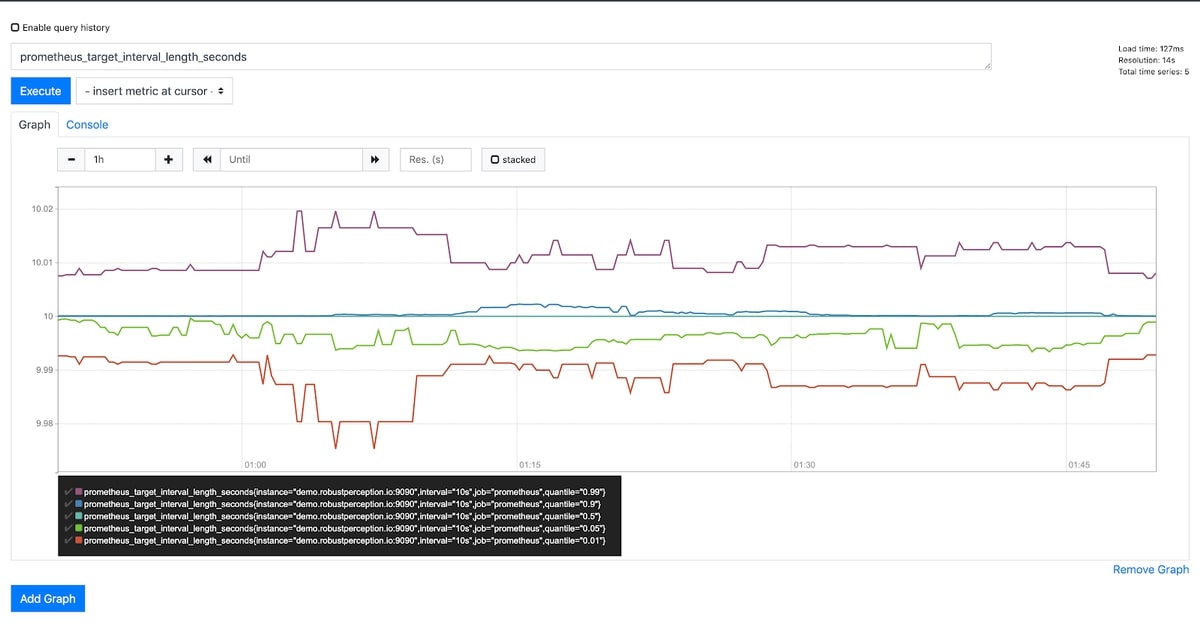
You can see a full tutorial here, with an example of importing Redis DB metrics into Prometheus. Prometheus will then scrape these metrics, and you can visualize them either using its expression browser, or a visualizer like Grafana. You can see an example of the Prometheus Expression Browser here:
Although it is possible to use these client libraries to monitor your applications running inside docker containers by incorporating the appropriate libraries and exposing whichever custom metrics you’d like to expose, you can’t use these libraries to get docker container metrics, such as the container cpu or memory usage, etc.
This used to be possible using container exporter, which exports docker container metrics directly to Prometheus. However, the container exporter method has been deprecated in favor of using cAdvisor to monitor container metrics and then exposing them to Prometheus as earlier described.
Choosing Prometheus does come with the tradeoff of having to do lots of configuration and maintenance. If you would like to skip these configuration and maintenance bottlenecks in favor of a instance that is easy and ready to go at a moment's notice, sign up for a free trial of MetricFire's Hosted Graphite or book a demo to talk to the team directly about how MetricFire can help you.
Conclusion
Given the vast popularity of containerized architecture and Docker in general, there exist several other monitoring options. Some of these include Datadog, Sysdig, SolarWinds, NewRelic, and SignalFx.
Each of these has its advantages and disadvantages, and also differs in architecture, with some being agent-based, and others being cloud hosted. Having so many options from which to choose can be challenging, but whichever you choose would depend massively on your use case or end goal.
If you need help deciding, feel free to reach out to MetricFire by booking a demo. We are experts in monitoring and we're here to guide you toward the best monitoring setup for you. Also, sign up for the free trial and experiment with the platform, you can get help on how to set it up directly in-app. Happy monitoring!


