
Table of Contents
Great systems are not just built. They are monitored.
MetricFire runs Graphite and Grafana as a fully managed service for growing engineering teams, taking care of storage, scaling, and version updates so your team doesn't have to. Plans start at $19/month, billed per metric namespace rather than per host, and include engineer-staffed support. Integrations work natively with Heroku, AWS, Azure, and GCP, and data is stored with 3× redundancy in SOC2- and ISO:27001-certified data centres.
This article was originally published on May 25, 2016, by Charlie von Metzradt, co-founder of Hosted Graphite, for the Hosted Graphite blog. Since then, Hosted Graphite has become MetricFire but our goal has stayed the same: Monitoring should be accessible. For more information and for updates on new features, book a time with our team!
An Introduction to Alerting
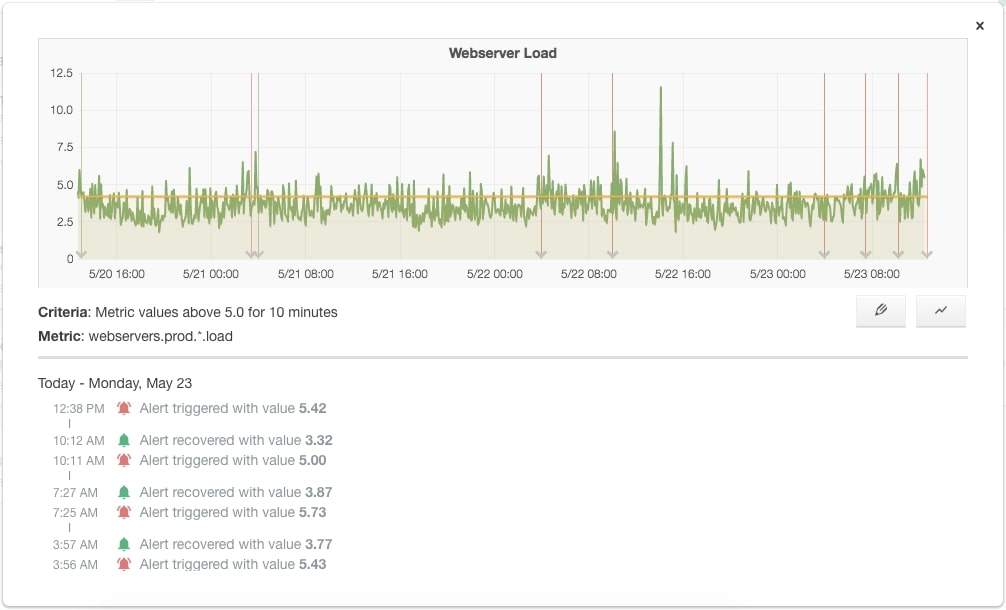
In this blog, we'll show you how Alerting for Graphite works. What do you need to look at when considering what you alert on, and where do those alerts go? An early warning system is only as good as its alarms.
What is alerting?
Monitoring uses alerts to tell you when something unexpected happens, if you need to act, and how you might fix a problem. Good alerts give you the right context to act and enough lead time to be effective. Bad alerts tell you what you already know or don't need to hear - once you know a database is down, you don’t need to be reminded every minute.
If monitoring gives you data, then alerting gives you information.
How to use Alerts
Done properly, your alerts should trigger only for states or events that require attention or intervention. If you flood your sysadmins with minor alerts, they will try to read them all or ignore them altogether - both poor outcomes! Every sysadmin I've ever spoken to gets a thousand-yard stare when I mention Nagios's propensity to fill your mailbox with redundant information.
For simple record keeping, set up descriptive logging in a human-readable format to capture an event so you can dig into it later - e.g. "Production web server number of 500 errors". A good rule of thumb for logging sensitivity is to trigger alerts on what might equate to syslog standard severity levels of Error and higher.
Each alert should capture at least these fields:
- Status - What’s wrong?
A simple, specific statement of what’s changed: a server offline, power supply interrupted, large numbers of users dropped, unusually long response times.
- Priority - How urgent is it?
- High - Something is on fire that must be fixed; wake the right person to tackle the problem. A smoke alarm in a data center needs a quick response from your on-call engineer, and probably the Fire Department, too. Medium - Something needs action but not right away; check the logs tomorrow so technical staff can follow up. Your secondary backup server running low on disk space is a risk for you to deal with this month, but not a crisis today. Low - Something unusual happened; email the details to create an evidence trail for later investigation. There are weird traffic patterns on your internal network - is everyone streaming Game of Thrones clips on Monday morning? Have a look when you get the chance.
- Next steps - What do we do?
A list of product/service owners, escalation paths, and immediate corrective actions. This is a good place for some easy troubleshooting - if the team working overnight can solve the issue with a reboot, then you don’t need to take it any further. Runbooks are a life-saver in the small hours of the morning, giving the bleary-eyed ops team some simple guidelines when nothing's making sense.
Further Tips
- Tune your thresholds regularly to eliminate noise and create alerts for previously undetected incidents. If load spikes during commercial breaks in the big game, tweak your alerts to accommodate that.
- Don’t confuse priority and severity. Extra processing time for an ecommerce transaction, for example, might be a medium-severity defect; but priority depends on factors such as user traffic and SLA terms. What’s an inconvenience on Easter Sunday could be a potential disaster on Black Friday!
- Disable alerts for test environments, maintenance windows, and newly deployed services - waking someone up for false positives makes for an angry ops team.
- Update your call sheet with current contact details - when time is crucial, there’s no room to chase down the former service owner who handed over their admin rights last month.
A final word
Every business has a different set of critical paths - you know your systems and people best. Alerts can be automated, but the wisdom behind them can’t be.
- Establish the remediation procedures that will be kicked off by alerts.
- Discuss with engineers the kind of diagnostic data that is useful to them - Hosted Graphite alerts can drop graph images directly into Hipchat and Slack, helping your team access the context they need to respond quickly and effectively.
- Write a text description of your alerts so that it gives unambiguous instructions for resolution.
An alarm doesn’t mean panic when everyone knows there’s an established process they can trust.