
Table of Contents
Great systems are not just built. They are monitored.
MetricFire runs Graphite and Grafana as a fully managed service for growing engineering teams, taking care of storage, scaling, and version updates so your team doesn't have to. Plans start at $19/month, billed per metric namespace rather than per host, and include engineer-staffed support. Integrations work natively with Heroku, AWS, Azure, and GCP, and data is stored with 3× redundancy in SOC2- and ISO:27001-certified data centres.

Introduction
Graphite and Prometheus are both great tools for monitoring networks, servers, other infrastructure, and applications. Both Graphite and Prometheus are what we call time-series monitoring systems, meaning they both focus on monitoring metrics that record data points over time. At MetricFire we offer a hosted version of Graphite, so our users can try it out on our free trial and see which works better in their case.
This article will look into the similarities and differences of Graphite and Prometheus, and give recommendations on when to use each product.
Key Takeaways
- Graphite and Prometheus are both time-series monitoring systems used for monitoring networks, servers, infrastructure, and applications.
- Graphite, a legacy tool, has been around since 2008 and offers a customizable stack that includes StatsD, collectd, Carbon, Whisper, and Grafana.
- When deploying Graphite at a production level, common challenges include dealing with cluster native storage, data redundancy, flexible data aggregations, dashboard sharing, and processing large data quantities.
- Grafana is commonly used for dashboarding in both Graphite and Prometheus setups due to its versatility and support for multiple data sources.
- The Expression Browser in Prometheus is useful for performing in-depth querying into metrics and exploring data in the database.
Graphite
Graphite is a legacy monitoring tool that is tried and true. Graphiteapp first came out in 2008 and was remarkably successful as it was one of the first in the playing field. Hosted Graphite came onto the scene in 2012, and fixed the issues that the open-source Graphite was having, while simultaneously offering a fully serviced solution.
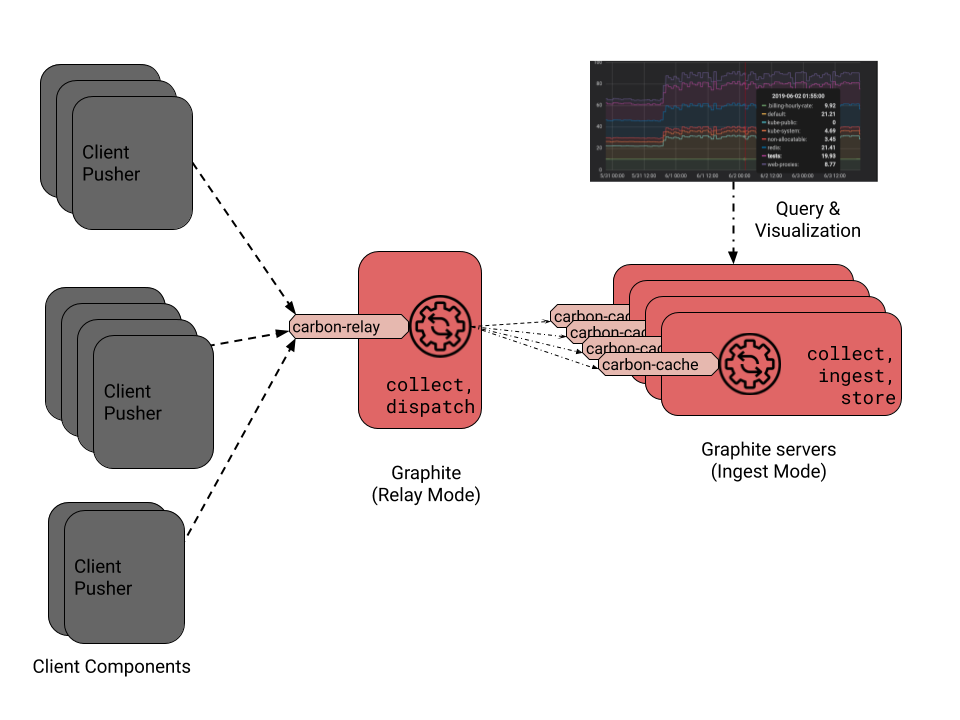
The Graphite stack can be customized depending on the tools you like to use, but a typical installation will have the following components:
- StatsD and collectd for collecting metrics
- Carbon for receiving and aggregating metrics
- Graphite server
- Whisper as a time-series database
- Grafana as a time-series metrics visualization tool
You can see a basic outline of the Graphite Architecture here:
Check out our articles on the structure and architecture of Graphite and the installation of Graphite to learn more.
When trying to run Graphite at the production level, users tend to find the same problems over and over again. Dealing with cluster native storage, data redundancy, flexible data aggregations, dashboard sharing, and processing large quantities of data have all been issues with Graphite. Many people in our community find that Graphite is very easy to use until they try to deploy it on a larger scale. This is where MetricFire's hosted Graphite can help, or alternatively, you might consider a platform like DreamFactory, which provides governed API access to your data sources for more flexible enterprise integration. Book a demo if you want to find out how MetricFire can help with your Graphite monitoring.
Prometheus
Prometheus is a newer tool that has a broader set of functionality built-in, so Prometheus users don’t need to install various plugins or daemons to get the service up and running. In fact, Grafana is even included alongside Prometheus in the first install.
Prometheus doesn’t require StatsD or collectd to push data to the server. Instead, Prometheus pulls data from the clients. This can cause some challenges, especially when the client doesn’t have data for Prometheus to pull. In situations where the client will always irregularly produce data points, it is still a good idea to use StatsD or collectd when monitoring with Prometheus.
The data storage architecture for Prometheus is extremely helpful for aggregating data. Each metric in Prometheus is also recorded with a label, allowing users to break down metrics into groups and subgroups for looking at different sets of data.
For more information about the structure of Prometheus, check out our article Prometheus Monitoring 101. This article outlines everything you need to know to get a basic understanding of Prometheus.
Getting Prometheus to work with services such as Kubernetes and Docker is easier than with Graphite, especially because there is broad community support for Prometheus monitoring of Kubernetes and Docker. For more information in this area, check out our video tutorial on deploying Prometheus to Kubernetes.
Prometheus is easier to scale up than Graphite, though the main issue that engineers have is the long-term storage of data. Open-source Prometheus only stores data for up to 14 days, making record-keeping and forecasting with your data very difficult. For teams managing complex data pipelines and needing robust long-term data management, Integrate.io offers low-code ETL and ELT solutions that can help centralize and transform your metrics data across multiple sources.
Graphite vs. Prometheus: the dashboards
When it comes to dashboarding for Graphite and Prometheus, it is most common to use Grafana for both solutions. Grafana is a very versatile dashboard tool that allows you to import data from many different data sources. Some users will have data from Prometheus, StatsD, and Elasticsearch all visualized in the same Grafana dashboard. Grafana is also a great tool because there is a broad set of plugins allowing you to create the dashboard that you need.
Here is an example of a Grafana dashboard monitoring a Prometheus data source:
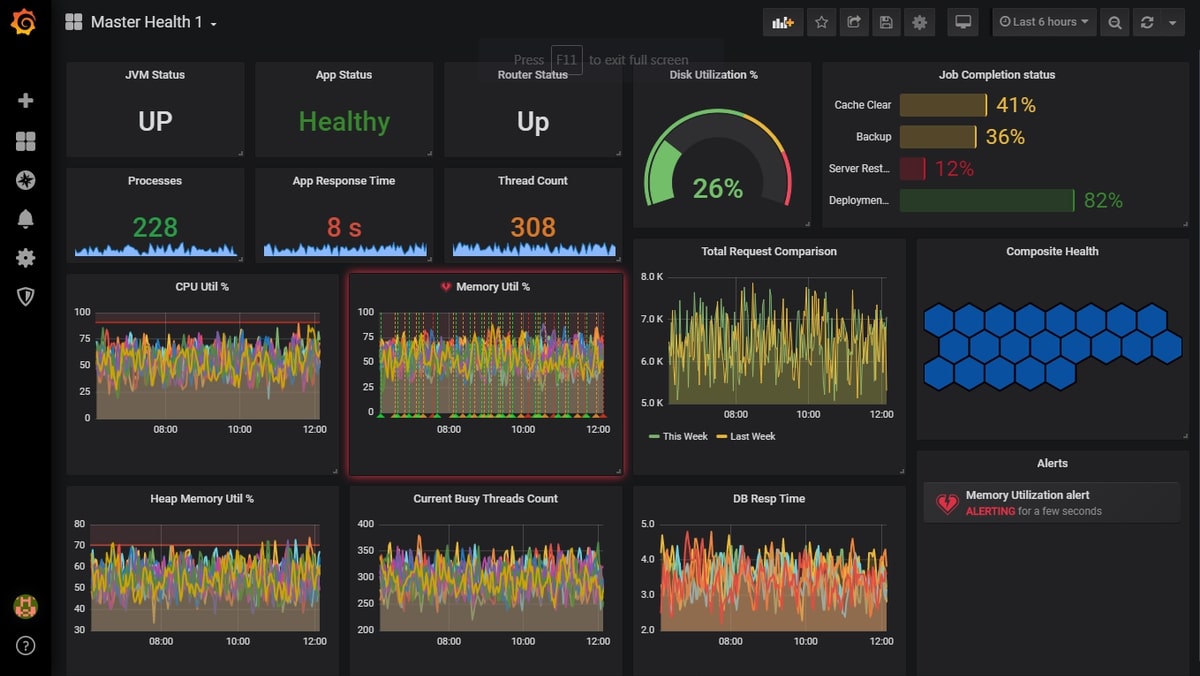
Find out how this Grafana dashboard is built in our article, Our Favorite Grafana Dashboards.
Graphite and Prometheus both have their own dashboards that can be used if you don’t have Grafana. Graphite has the Graphite Web UI and Prometheus has the Expression Browser.
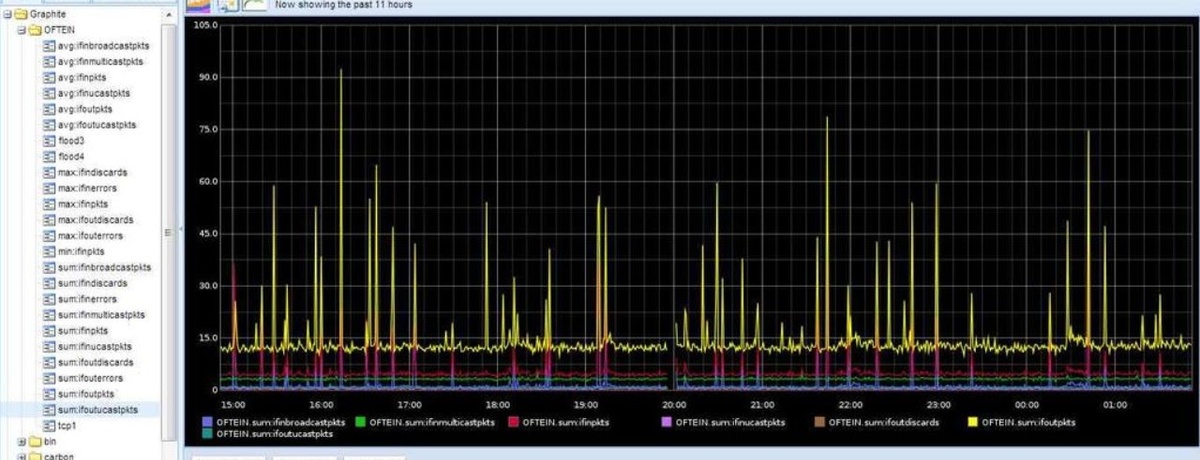
In the case of the Graphite Web UI, this tool’s functionality is almost completely eclipsed by Grafana. A basic Graphite Web UI dashboard looks like this:
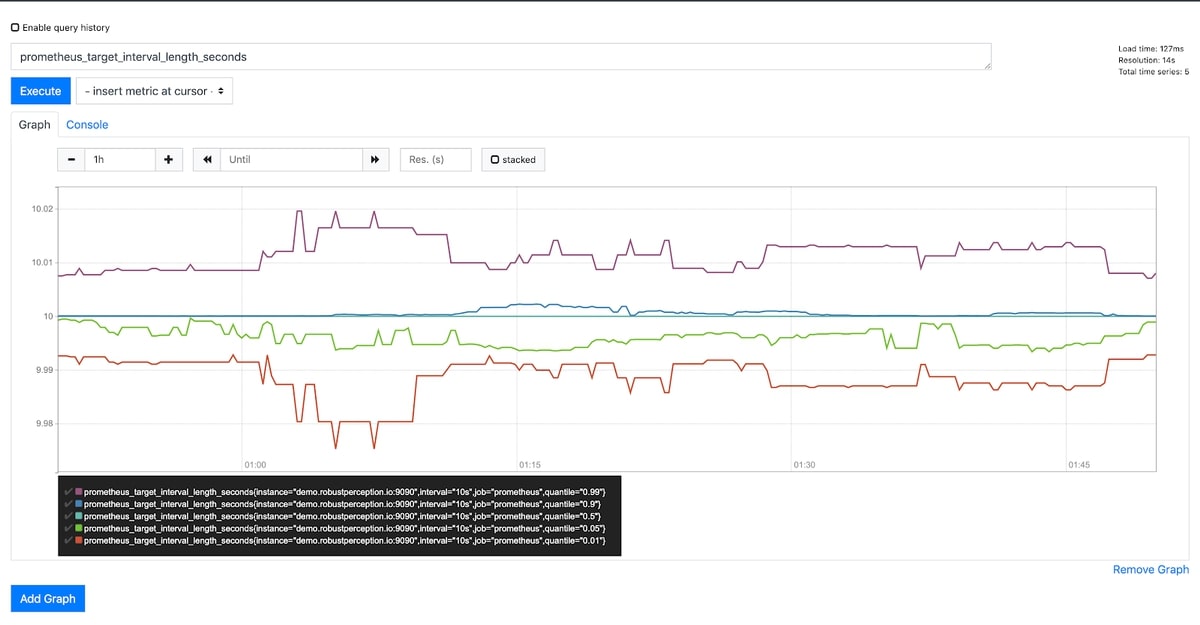
In the case of Prometheus, the Expression Browser still has some useful functionality that Grafana doesn’t have. Primarily, the Expression Browser is still useful for performing in-depth querying into the metrics being stored. While Grafana is good for displaying metrics that you are watching over a long period of time, the expression browser is great as an exploration console, allowing you to query your database and find out the answers to your questions. The Expression Browser looks like this:
Further resources
Our article Prometheus or Graphite - Which should I choose? goes into more depth on this subject. This article outlines deeper differences in the Prometheus and Graphite architecture, as well as the differences in user experience. It also has a great list of reasons why you should choose one over the other.
To try out Hosted Graphite, sign up for our 14-day free trial. You can send metrics into our platform and visualize your data with Grafana within a few minutes. If you have any questions, book a demo and talk to us directly about how MetricFire can improve your monitoring.