
Table of Contents
Great systems are not just built. They are monitored.
MetricFire runs Graphite and Grafana as a fully managed service for growing engineering teams, taking care of storage, scaling, and version updates so your team doesn't have to. Plans start at $19/month, billed per metric namespace rather than per host, and include engineer-staffed support. Integrations work natively with Heroku, AWS, Azure, and GCP, and data is stored with 3× redundancy in SOC2- and ISO:27001-certified data centres.
Key Comparison Points
Before we discuss the specifics of Grafana and Datadog, let's examine the main comparison points. Grafana is a great dashboard that allows you to plug in essentially any data source. It is most commonly paired with Prometheus, Graphite, and Elasticsearch to provide a full APM, time series, and logs monitoring stack.
Using an open-source stack like this is excellent for anyone who needs high-quality features. But, the downside is the challenge of maintaining a monitoring stack independently. That's where MetricFire comes in. MetricFire runs a Hosted Grafana service, so you don't have to do the work. MetricFire offers the best of both worlds: the flexibility and quality of open source without any of the headaches of installing or maintaining it.
Datadog is a well-rounded monitoring tool that combines the agent, storage, querying, and dashboard into one product. The downfall of having one tool for everything is that Datadog is a specialist in nothing.
So, how do you choose between the Grafana stack and Datadog? The answer is:
- If you need an all-around tool that can do a little bit of everything, choose Datadog.
- If you need flexibility and the power of monitoring with highly-developed tools, such as Elasticsearch, choose Grafana.
- If you need everything Grafana has but without the headache of maintaining it, choose MetricFire.
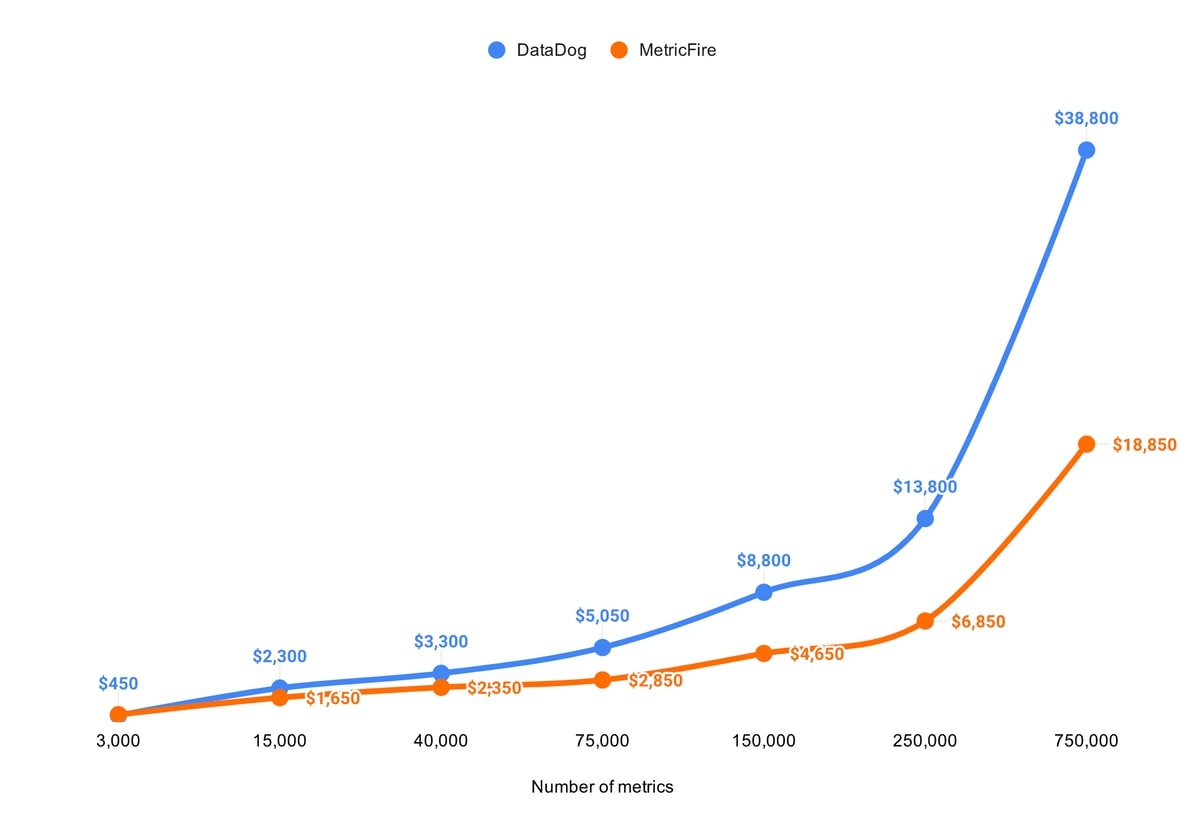
Scaling is also an important point. Hosted Grafana by MetricFire is built for scale, but Datadog isn't. Not everyone needs hundreds of thousands of metrics, but if you do, double-check what your bill will be at Datadog.
At Datadog, it's easy for your custom metrics monitoring bill to escalate. Datadog charges 5.00 USD for every 100 custom metrics after the first 2,000 or 3,000 metrics. That means if you monitor 250,000 custom metrics, your Datadog bill will be over 10,000.00 USD monthly. Just check out this pricing graph that shows what you pay at Datadog vs. MetricFire:
Grafana and hosted Grafana by MetricFire are built for scaling, and their foundations on advanced open-source software provide a great quality of monitoring. Datadog is built to be an all-around tool for people who need a little bit of everything. To find out more, you should book a demo with the MetricFire team!
Now, let's dive into a detailed look at Grafana and Datadog.
What is Grafana?
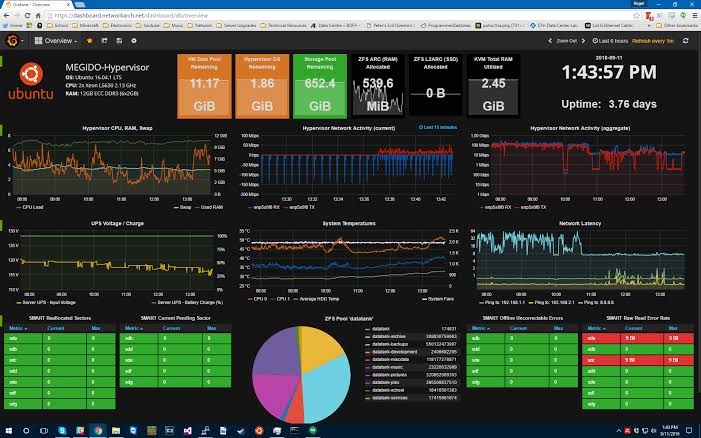
Grafana is a visualization tool that allows you to see and analyze your metrics in one unified dashboard. Grafana can pull metrics from any source, such as Graphite, display that data, and then enable you to annotate and understand the data directly in the dashboard. Grafana dashboards are designed to allow you to visualize information in many ways, from histograms and heat maps to world maps. Grafana also has an alerting feature that can communicate with you through Slack, PagerDuty, and more. Dashboards can be shared, downloaded, or expanded with hundreds of plugins that make analysis easier. Grafana is open source, and Grafana as a Service is available through MetricFire. For organizations that need more than just visualization and want to integrate their monitoring data with other enterprise systems, DreamFactory provides a self-hosted platform for governed API access to any data source, enabling seamless integration between your monitoring stack and other enterprise applications.
Get on our free trial and start making Grafana dashboards in minutes. You can see if Grafana is the right fit for you. If you have any questions, you can book a demo and talk to us directly.
What is Datadog?
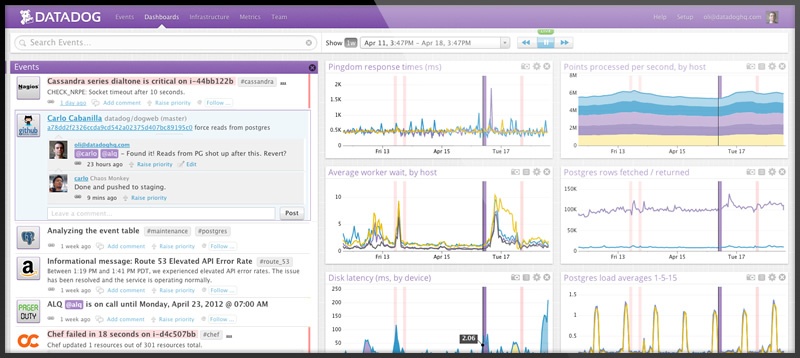
Datadog lets you view infrastructure metrics, traces, and logs on the same dashboard. It also supports visualization, troubleshooting, monitoring, and alerting. Datadog integrates with hundreds of different apps or services and can communicate with any environment, such as servers, containers, mobile, web browsers, and cloud services. Its primary target is to see inside any stack and any app. Datadog also supports alerts and collaboration and allows you to combine data from various sources into one visual.
When to use Grafana?
Use Grafana when you …
- need beautiful, simple, annotated graphs.
- have multiple sources of metrics or logs and need to see them in one place.
- need to share your dashboards across the organization.
- need to reorganize information based on specific team needs.
- need an easy-to-use query builder.
- need alerting for events.
When to use Datadog?
Use Datadog when you …
- want to monitor infrastructure or apps.
- want to visualize data from any source, even on the same graph.
- want to communicate with the team directly in the dashboard.
- need alerting for events.
Pricing comparison
- Grafana is open-source and free.
- Business-ready Grafana as a Service by Metricfire, including hosted graphite, starts at 16 USD monthly.
- Datadog’s Enterprise package starts at $23 per monthly host, with a minimum sign-up of 100 hosts.
- For less than 100 hosts, Datadog’s pro package is $15 per host per month.
Key takeaways
- Grafana can integrate with many collectors, agents, and storage engines.
- Grafana is open-source and accessible.
- Datadog can monitor any infrastructure or apps by integrating them into almost any environment.
- Datadog is proprietary and has an enterprise package starting at 2300 USD monthly.
Get to know our Grafana as a Service better, and check out how MetricFire can fit into your monitoring environment! Get a free trial and start making Grafana dashboards right away. Feel free to book a demo if you have questions about what Grafana can do for you.