

Table of Contents
Great systems are not just built. They are monitored.
MetricFire runs Graphite and Grafana as a fully managed service for growing engineering teams, taking care of storage, scaling, and version updates so your team doesn't have to. Plans start at $19/month, billed per metric namespace rather than per host, and include engineer-staffed support. Integrations work natively with Heroku, AWS, Azure, and GCP, and data is stored with 3× redundancy in SOC2- and ISO:27001-certified data centres.
Introduction
So, you’ve got a PostgreSQL database packed with juicy data, and you want to turn those raw numbers into slick, interactive Grafana dashboards? Good call! Grafana’s PostgreSQL datasource is like the secret handshake that lets you visualize your data in style—no extra ETL magic required. In this guide, we’ll walk through getting PostgreSQL and Grafana to play nice, covering everything from connection settings to query tuning. Whether you’re debugging performance metrics or just flexing your SQL muscles, by the end of this, you’ll have a fully operational setup. Let’s dive in!
This guide covers installing PostgreSQL, allowing remote connections, and configuring Grafana to visualize live data. Don't have Grafana yet? Sign up for MetricFire's free trial to try it out and follow along with this tutorial!
Install and Configure PostgreSQL
It's no secret that PG is a popular database among developers, and we're all about keeping things PG here! This guide helps you quickly set up PostgreSQL for external connections without requiring SSL certificates. While allowing all connections can simplify initial setup, it is best practice to secure your database with SSL to prevent unauthorized access and data interception. For detailed steps on configuring PG with SSL encryption and certificate-based authentication, check out our separate guide HERE.
This article also assumes that you already have an instance of PostgreSQL up and running. If not, we've included some steps on how to install/configure/run this on your own server (Linux):
- sudo apt update
- sudo apt install postgresql postgresql-contrib -y
- sudo systemctl enable --now postgresql
Create a DB and User
Login: sudo -u postgres psql
CREATE DATABASE testdb;
CREATE USER grafana_user WITH ENCRYPTED PASSWORD 'your_secure_password';
GRANT ALL PRIVILEGES ON DATABASE testdb TO grafana_user;
Allow Remote Connections
To allow PostgreSQL to accept connections from any IP address, modify the file typically located at: /etc/postgresql/<version>/main/postgresql.conf to reflect the following change:
listen_addresses = '*'
Confirm the changes were applied:
- sudo -u postgres psql -c "SHOW listen_addresses;"
To ensure that Grafana can connect using the username and PW created in the first steps, modify the host based authentication file typically located at: /etc/postgresql/<version>/main/pg_hba.conf
host testdb grafana_user 0.0.0.0/0 md5
Restart PostgreSQL for changes to take effect
- sudo systemctl restart postgresql
- sudo systemctl status postgresql
- sudo ufw allow 5432/tcp
- sudo ufw reload
- sudo netstat -tulnp | grep postgres
- sudo ss -lntp | grep 5432
Insert Sample Data
Login to PG: sudo -u postgres psql
Switch to your example database: \c testdb;
Confirm you are in the correct db and instert some data:
SELECT current_database();

CREATE TABLE public.sample_data (
    id SERIAL PRIMARY KEY,
    name TEXT NOT NULL,
    value INT NOT NULL,
    created_at TIMESTAMP DEFAULT NOW()
);

INSERT INTO public.sample_data (name, value, created_at) VALUES
    ('CPU Load', floor(random() * 100), NOW()),
    ('Memory Usage', floor(random() * 15500) + 500, NOW()),
    ('Disk Space', floor(random() * 490) + 10, NOW());
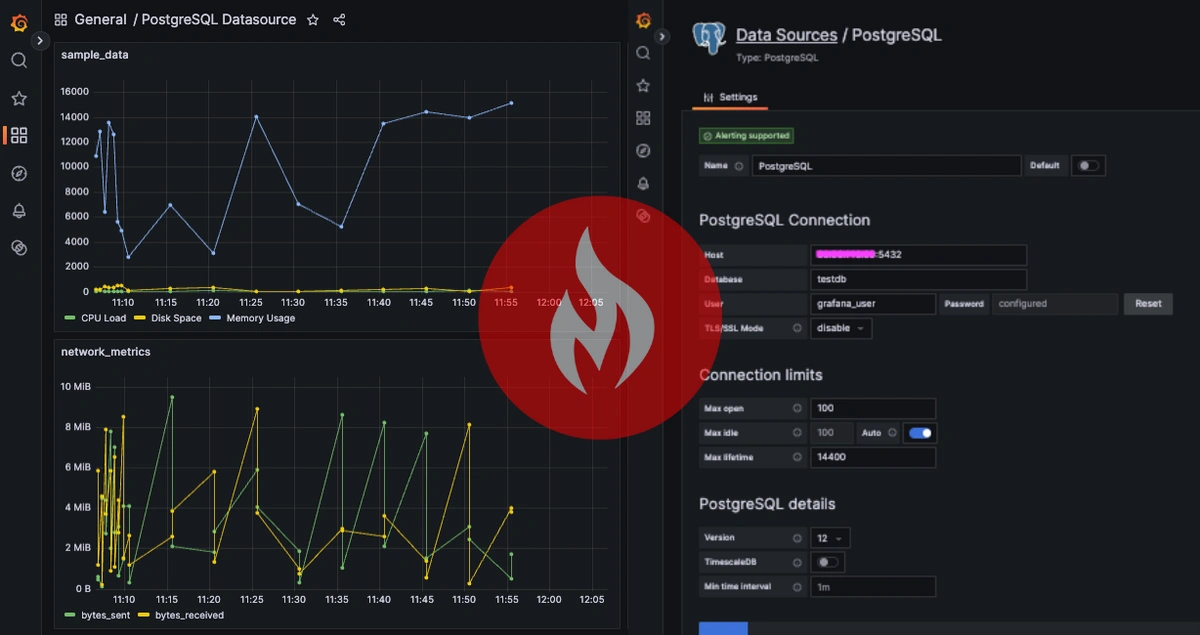
Configure a Grafana PostgreSQL Data Source
- Go to: Grafana → Configuration → Data Sources → PostgreSQL
- Enter Details:
- Host:
<PostgreSQL_Server_IP>:5432 - Database:
testdb - User:
grafana_user - Password:
your_secure_password
- Host:
- Set SSL Mode:
disable - Click "Save & Test"
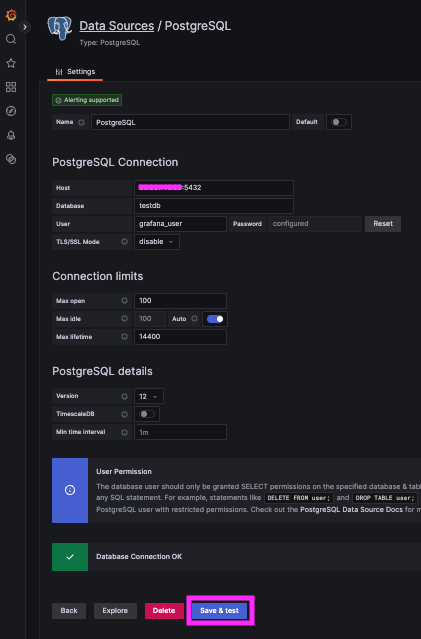
Again, when allowing remote connections to a production DB, you should always use SSL certificates and should reference the related article HERE.
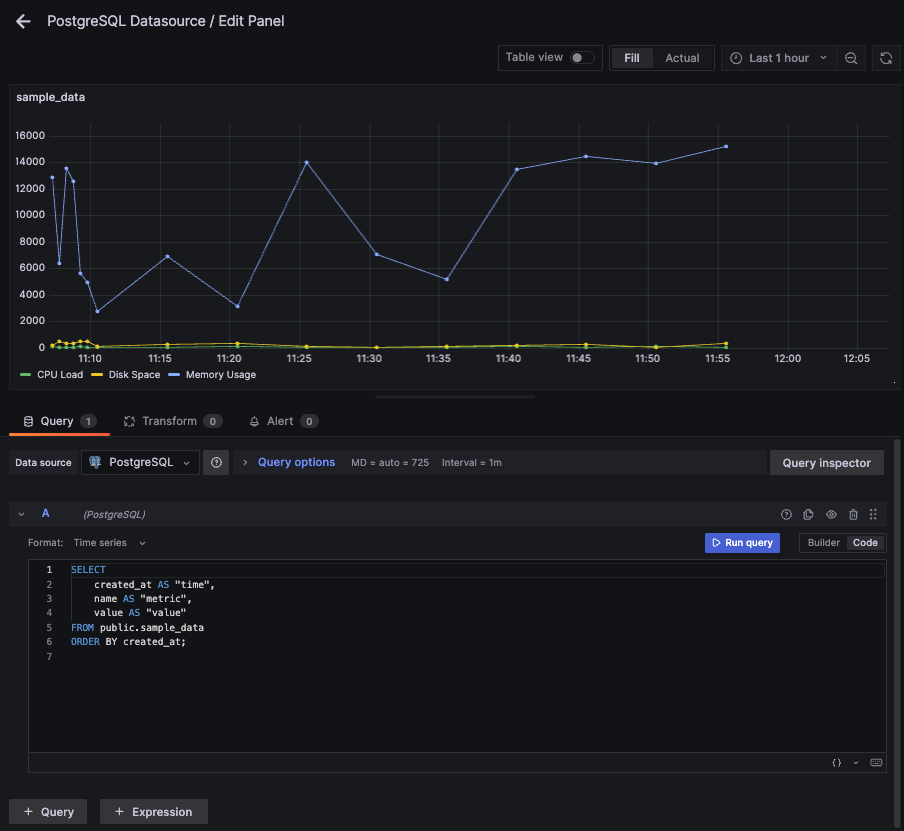
Create a Grafana Dashboard Panel
In your instance of Grafana, go to → Dashboards → New Dashboard → "Add a new panel"
Select your new PostgreSQL Datasource, set format as Time Series, select the Code option, and enter a Query for your sample data:
SELECT created_at AS "time", name AS "metric", value AS "value"
FROM public.sample_data
WHERE created_at >= now() - interval '5 minutes'
ORDER BY created_at;
Then Save your changes by clicking Apply.
Conclusion
Boom! You’ve just leveled up your PostgreSQL game by making it remote-friendly, and Grafana-ready—no more rogue queries streaking across the internet in plain text. Now, with a few clicks, you can visualize database trends, track performance metrics, and flex your data skills like a true dashboard ninja. Whether you're monitoring system health, tracking app usage, or just love watching numbers dance in Grafana, this setup gives you real-time insights with zero guesswork. For teams managing complex data workflows across multiple systems, platforms like Integrate.io can help streamline your data pipelines before they reach Grafana, enabling seamless ETL and data transformation. So why wait? Spin it up, graph it out, and make your data work for you!
Sign up for the free trial and begin monitoring your infrastructure today. You can also book a demo and talk to the MetricFire team directly about your monitoring needs.


