


Table of Contents
Great systems are not just built. They are monitored.
MetricFire runs Graphite and Grafana as a fully managed service for growing engineering teams, taking care of storage, scaling, and version updates so your team doesn't have to. Plans start at $19/month, billed per metric namespace rather than per host, and include engineer-staffed support. Integrations work natively with Heroku, AWS, Azure, and GCP, and data is stored with 3× redundancy in SOC2- and ISO:27001-certified data centres.

Introduction
In this article, we are going to look at the architecture of Apache ActiveMQ and how to monitor critical metrics of ActiveMQ using Dashboards.
If you would like to follow the steps in this blog, make sure to sign up for the MetricFire free trial, you should also book a demo with us.
You can use Graphite and Dashboards directly from our platform. MetricFire is a Hosted Graphite and Dashboards service, where we do the setup and management of these open-source tools so you don’t have to.
Key Takeaways
- Apache ActiveMQ is a popular open-source software for asynchronous message communication between distributed applications, based on the Java Message Service (JMS) API.
- ActiveMQ supports various wire protocols, making it interoperable with systems that support AMQP, MQTT, STOMP, and more.
- ActiveMQ follows a messaging architecture where messages are produced by a producer and consumed by one or more consumers, either in a point-to-point or publish-subscribe pattern.
- To monitor ActiveMQ, you can use Java Management Extensions (JMX) and third-party integrations like Prometheus.
- Key ActiveMQ metrics that can be monitored include memory usage, consumer count, producer count, queue size, expired messages, disk storage usage, message counts, and more.
Introduction to ActiveMQ
Apache ActiveMQ is one of the most popular open-source software for asynchronous messages between distributed applications. It is based on Java Message Service (JMS) API, which is the standard defined by Java Enterprise Edition on how to create, send, and receive messages across distributed applications.
ActiveMQ also supports a variety of wire protocols such as AMQP, MQTT, and STOMP allowing it to be interoperable with systems that support those protocols as well. ActiveMQ is also available on the cloud as Amazon MQ by AWS.
ActiveMQ Architecture
Before we get into monitoring Apache ActiveMQ, it's important to understand the architecture and basic building blocks of ActiveMQ. In ActiveMQ, messages are produced by a Producer and are consumed by another application called Consumer.
The message in ActiveMQ can either be read by just one consumer or multiple consumers. When it's read by a single consumer, it's called point-to-point message and the message is usually placed on the queue.
When the message is supposed to be read by multiple consumers, it is basically a publish-subscribe pattern where multiple applications are interested in subscribing to a piece of information. In this case, a message is placed on a topic, where multiple consumers can subscribe to this topic.
In this entire architecture, ActiveMQ or any other messaging system (such as Kafka or RabbitMQ) is generically referred to as a broker, as can be seen in the picture below

ActiveMQ monitoring options
Apache ActiveMQ provides various monitoring options such as JMX and other third-party integrations. However, each of the monitoring integration with ActiveMQ is based on Java Management Extensions (JMX).
Java Management Extensions (JMX) is a technology that was introduced with Java 1.5 and enabled tools and technologies for monitoring Java applications. Specifically, it provides Java applications with tools for managing and monitoring applications.
Monitoring ActiveMQ with Prometheus and JMX Exporter
Prometheus is an open-source monitoring solution originally developed by SoundCloud. Since then, it has been adopted by many organizations as their monitoring and alerting solutions. One of the advantages of Prometheus is that it comes with support for almost all the systems we want to monitor such as databases, Operating systems, etc.
Prometheus is designed to work with pluggable exporters. An exporter is a script or a service that will fetch metrics from the application being monitored and feed the data to Prometheus. Prometheus integrations page gives the list of the most popular exporters for all third-party systems out there.
For example, in this case, we are going to use a service called JMX Exporter. JMX exporter service gets the data from ActiveMQ and exposes it on the network port (8080 by default). Once the JMX exporter exposes the ActiveMQ metrics, we instruct Prometheus to connect to this port, read the data, and store it in its time series database at regular intervals.
MetricFire offers a Prometheus-alternative service with hassle-free setup and management. You can get started right away with our 14-day free trial, or book a demo to speak with an expert today.
Download and configure the JMX Exporter
First, we’ll need to download the JMX exporter JAR from the github repository.
Once the JAR is downloaded, we will instruct ActiveMQ to load it as an agent on application startup. In the case of ActiveMQ, we can do that by modifying /bin/env with the following contents:
-javaagent:/path/to/jmx_exporter_jar/jmx_prometheus_javaagent-0.3.1.jar=[HTTP PORT]:/path/to/jmx_exporter_config/config.yml
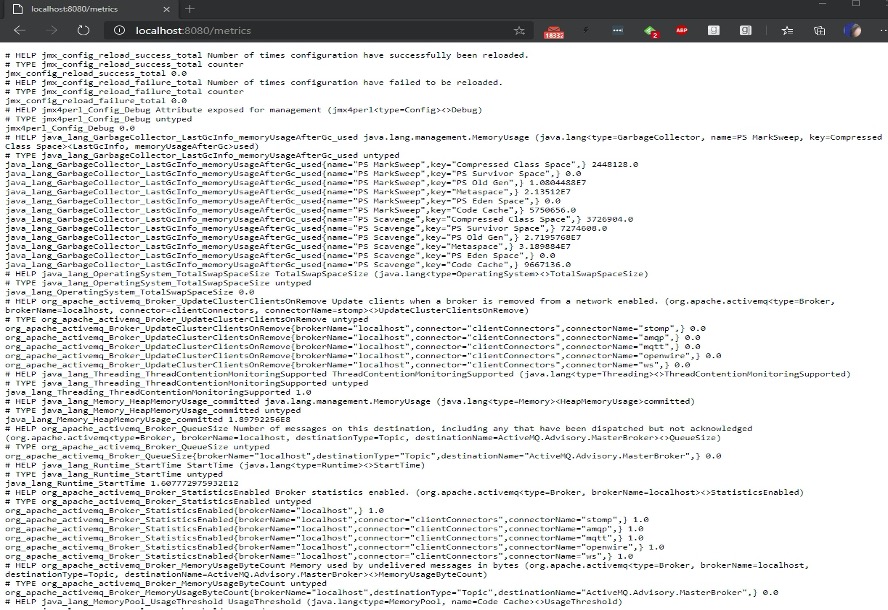
Once we fire up ActiveMQ after adding the relevant parameters, we can see the metrics exposed by opening http://localhost:8080/metrics on your local browser.
Setting up ActiveMQ for Monitoring
Now that ActiveMQ is successfully set up and exposing its metrics, we will configure Prometheus to read the metrics exposed by JMX Exporter. Configuring prometheus to read Apache ActiveMQ metrics is as simple as adding the following configuration in prometheus.yml, resulting in Prometheus calling the JMX exporter and reading the metrics.
global:
    scrape_interval: 15s
    external_labels:
        monitor: "activemq"

scrape_configs:
    - job_name: "activemq"
      scrape_interval: 5s
      static_configs:
          - targets: ["activemq-hostname:8080"]
Here the name, activemq-hostname refers to the host where ActiveMQ is running.
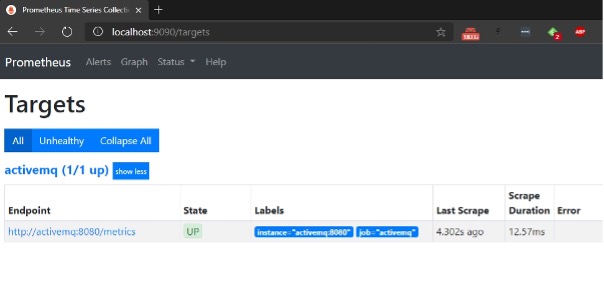
We can verify if Prometheus is successfully scraping the metrics by visiting http://promethus-host:9090/targets.
We should see that target ActiveMQ is in state UP and shows the last scrape time.
Setting up Prometheus to send data
We will be using Prometheus as a long-term data storage for our metrics. In order to send data to Prometheus, add new remote_write and remote_read sections like this:
remote_write:
  - url: https://prod.promlts.metricfire.com/write
    bearer_token: Your-API-key-goes-here
remote_read:
  - url: https://prod.promlts.metricfire.com/read
    bearer_token: Your-API-key-goes-here
The page will give you your secure API key which will be used to send metrics from local Prometheus to Hosted Prometheus.
Plotting the visualization on Dashboards
Now that our Hosted Prometheus is receiving metrics from the ActiveMQ, it’s time to plot the metrics on the dashboards.
So, let’s log in to MetricFire at https://www.hostedgraphite.com/app and browse to Dashboards -> New Dashboard to open the Dashboard page.
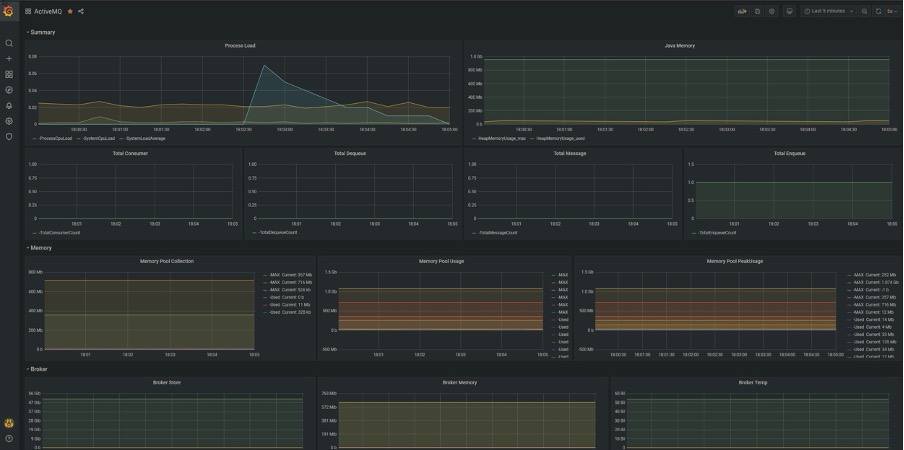
The dashboard itself comes with a lot of pre-built dashboards that we can import and reuse. In this case, we are going to re-use a pre-built dashboard from the dashboards library.
First, download the dashboard from the “Download JSON” link and import it into the dashboards through the import option. Make sure to choose the Prometheus data source as “metricfire-prometheus-v2” as shown below.
Once imported, we will be able to see the metrics visualized as shown below.
Here's some more images of the above panel types, zoomed in:
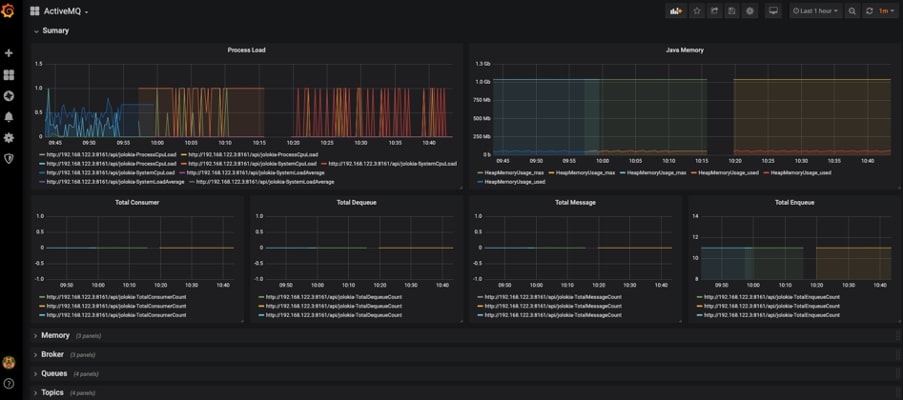
ActiveMQ Summary
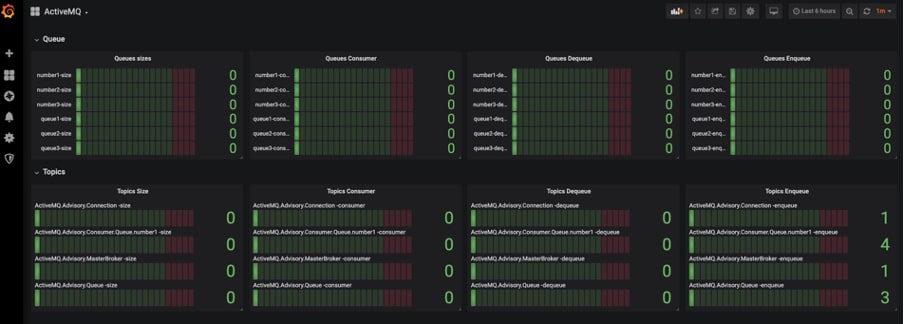
Queues / Topic Metrics
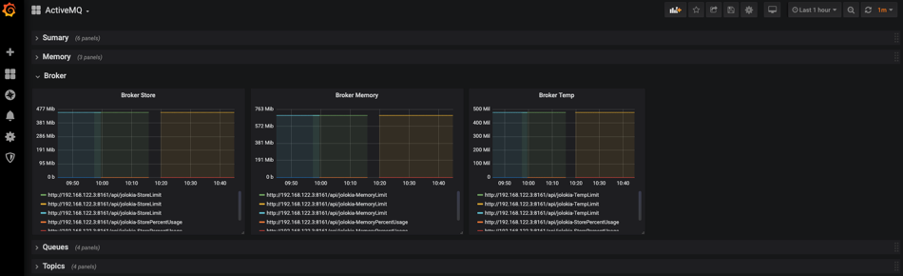
Broker Metrics
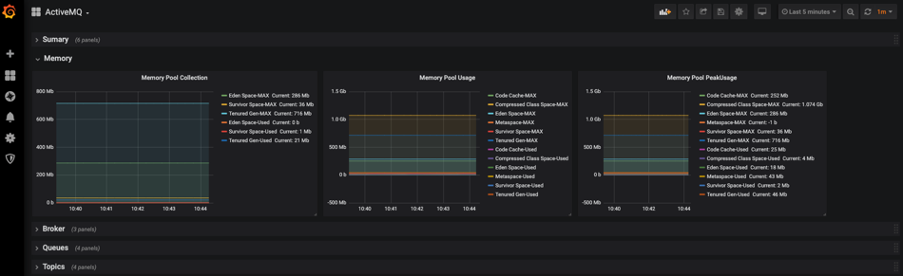
Memory Metrics
Our dashboards are a very powerful visualization tool built over it. It allows you to create your own visualizations as well as setup alerts whenever a metric value crosses a certain threshold. Check out our article dashboards from Basic to Advanced for a complete guide on how to set up alerts, and build custom dashboards.
You can also create other types of visualizations based on the metrics exposed by Kubernetes. Have a look at the article Our Favorite Dashboards to create some of the more advanced dashboards.
Key ActiveMQ Metrics
JMX Exporter for Apache ActiveMQ exposes a lot of metrics. Some of the key metrics are given below:
|
|
||
|
|
||
|
|
||
|
|
||
|
|
||
|
|
||
|
|
||
|
|
||
|
|
||
|
|
||
|
|
||
|
|
||
|
|
||
|
|
||
|
|
Conclusion
In this article, We looked at the architecture of Apache ActiveMQ and how Hosted Graphite and Dashboards can help us monitor ActiveMQ without much setup. For organizations that need to integrate metrics from multiple sources, Integrate.io offers low-code ETL and ELT pipelines to help consolidate monitoring data across your stack.
To get started right away, sign up for MetricFire’s free trial of our Hosted Graphite and Dashboards. Also, if you have any questions about our products, or about how MetricFire can help your company, talk directly to one of our experts by booking a demo.


