Table of Contents
A guide to provide more data to your graphs, so you can easily correlate events with changes in the performance
Problem: you have set up MetricFire to monitor your application, but you are constantly updating the application. How do you track what changes affect the metrics on your Grafana dashboard? For example, you are monitoring your website’s web servers and checking how many resources your website is using. Then, you have several people working on the same site using GitHub as version control, and several changes were made over the week. How would you know which code change to the site affected the performance of the servers?
Solution: We can answer this question if we implement a webhook in our GitHub repository that automatically sends information about events to our Grafana Github add-on, which directly creates annotations on the Grafana Graph. These annotations indicate exactly what Github event occurred and what the change was.
This article will show how to get Github events integrated as annotation points on your graphs to create a more clear picture of what is going on. To start, take a look at the add-ons on Hosted Graphite. If you haven’t tried MetricFire yet, get started with a free 14-day trial and check our docs for tips on getting started. There are a number of supported annotation add-ons listed in the Add-ons section when you log into your Hosted Graphite account.
Webhooks and Annotations
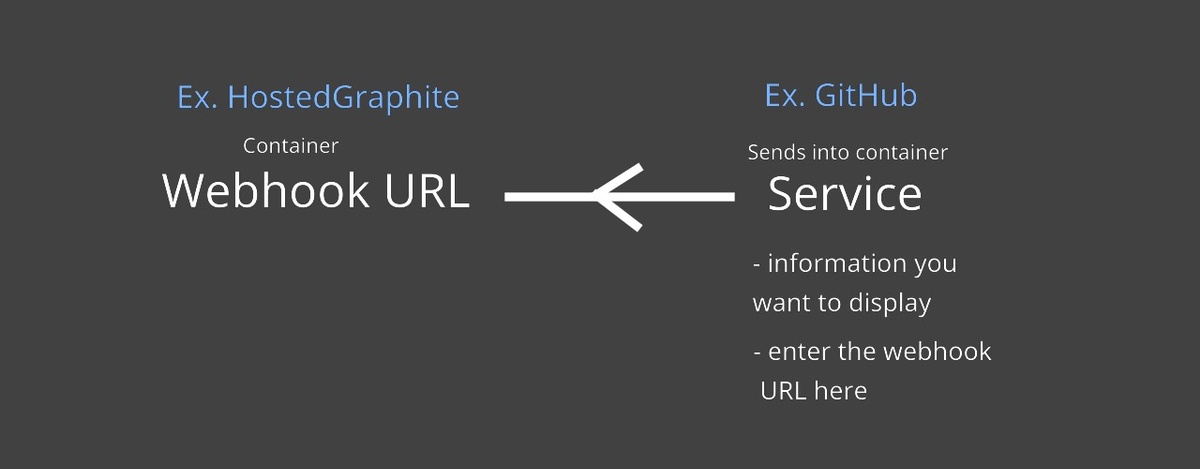
Webhooks: They might seem like APIs but they are slightly different. APIs require a manual request to give back a response, but webhooks skip the request step because they automatically send payload data whenever something changes. With a webhook URL, you can send payload data to that URL. Check the image below for a basic visual of how webhooks work.
Annotations: They are pretty much like small sticky notes on your graph. They are good for keeping track of any changes that happen during the timeline on your graphs. For example, you can create annotations with Pingdom to see when your webserver gets an outage and what caused it. You can understand the causes of a problem better if you can compare events, the timing of the events, and the changes in the metrics that happened around the same time.
Setting things up
We will be using MetricFire to integrate these webhooks, as setting up MetricFire is much easier than setting up the open-source Graphite. The service we will be adding on is GitHub so that GitHub can inform us of when an event occurs.
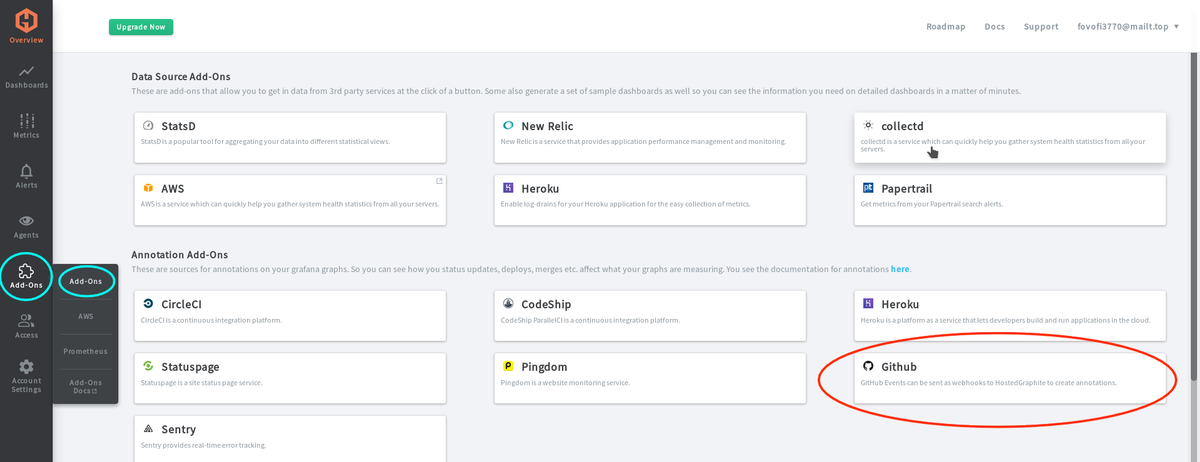
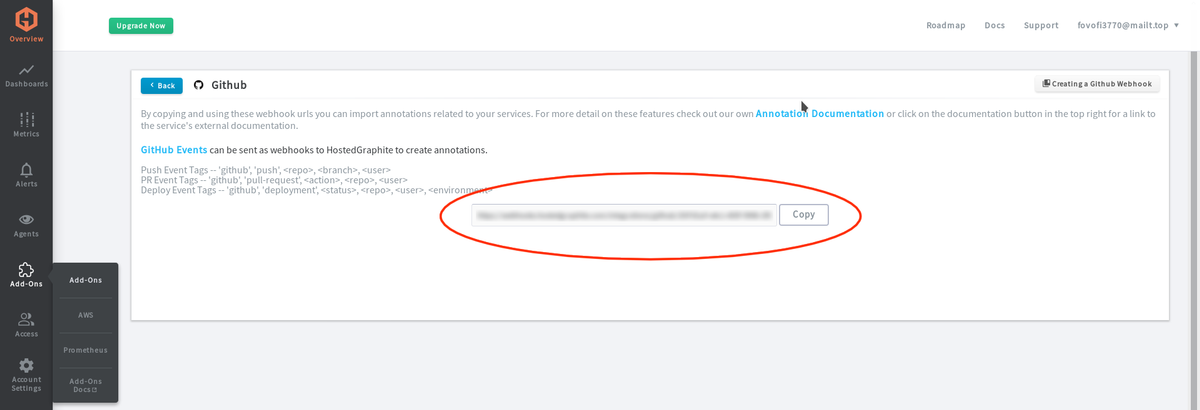
First we will get our Hosted Graphite’s webhook URL for GitHub. We will take the webhook URL from the Hosted Graphite interface and copy and paste it into the GitHub interface. Go to Add-ons -> Add-Ons -> GitHub, and that should bring you to a page with your GitHub webhook URL.
Now that we have our webhook URL we can make GitHub send data to our URL. Go to the repository that you want to monitor. Go to Settings, and then to Webhooks. You will see a form for adding webhooks. Fill out the required info such as the Payload URL, Content type, and which kind of events you would like to send to Hosted Graphite. The Payload URL is the URL you copied from the GitHub add-on page on Hosted Graphite. When you're done filling it out, hit "Add webhook". Check out the image below to see the "add webhook" page on GitHub:

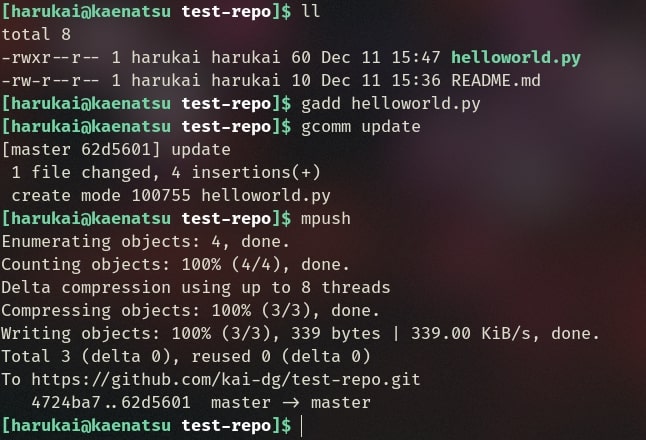
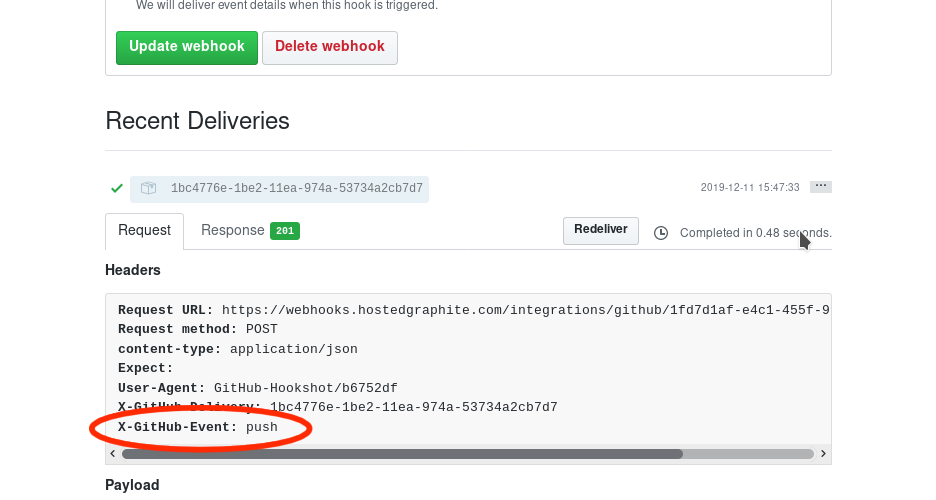
Once that webhook is added, whenever GitHub gets an update (like a push or merge), it will send data to Hosted Graphite. Let’s confirm that GitHub is sending data to Hosted Graphite. Do a quick push to change something in your repo, and then check on the webhook page that we setup earlier. Check the image below to see the GitHub push:
Now check your webhook page in GitHub. If you see a green check on Recent Deliveries on your repository’s webhook tab (at the very bottom) that means GitHub has successfully sent data to Hosted Graphite. A detailed report can also be shown on each piece of data that was sent. You can check the headers and see what GitHub Event was sent to Hosted Graphite. You can refer to this event later on when setting up our Grafana dashboard to display the data that was sent.
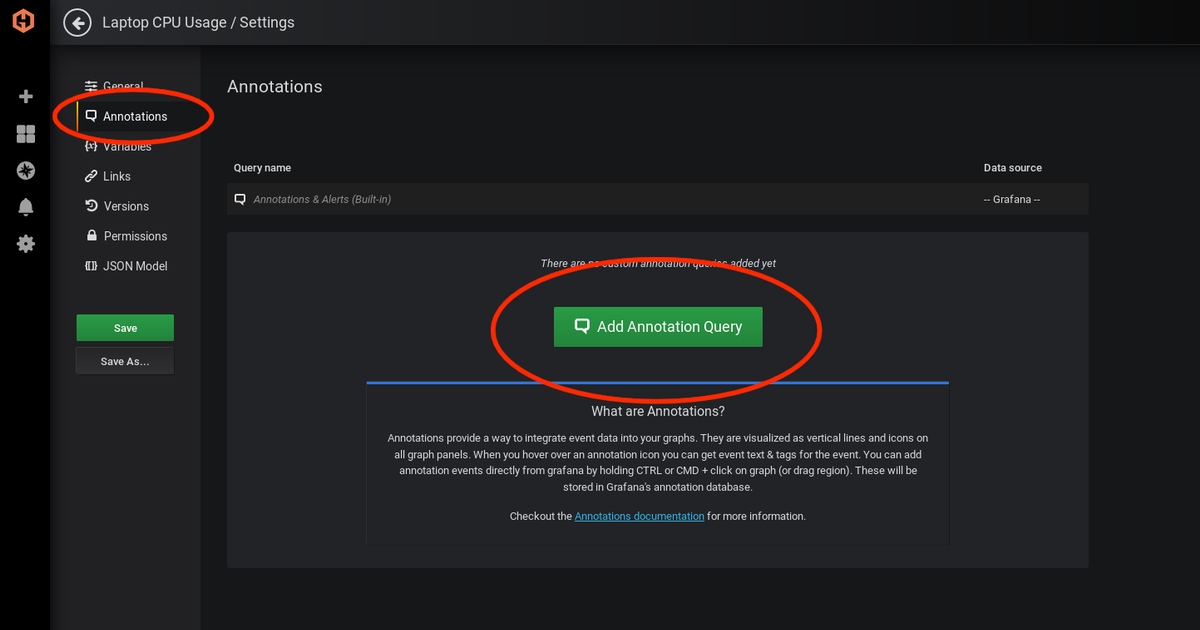
Next we need to set up our Grafana Dashboard to display the data that GitHub has sent. From your Hosted Graphite main page go to Dashboard, then to Grafana. In the settings on the top right-hand corner, select the dashboard you want to display your GitHub data on.

Then we need to add an annotation. Go to Annotations, then to Add Annotation Query.
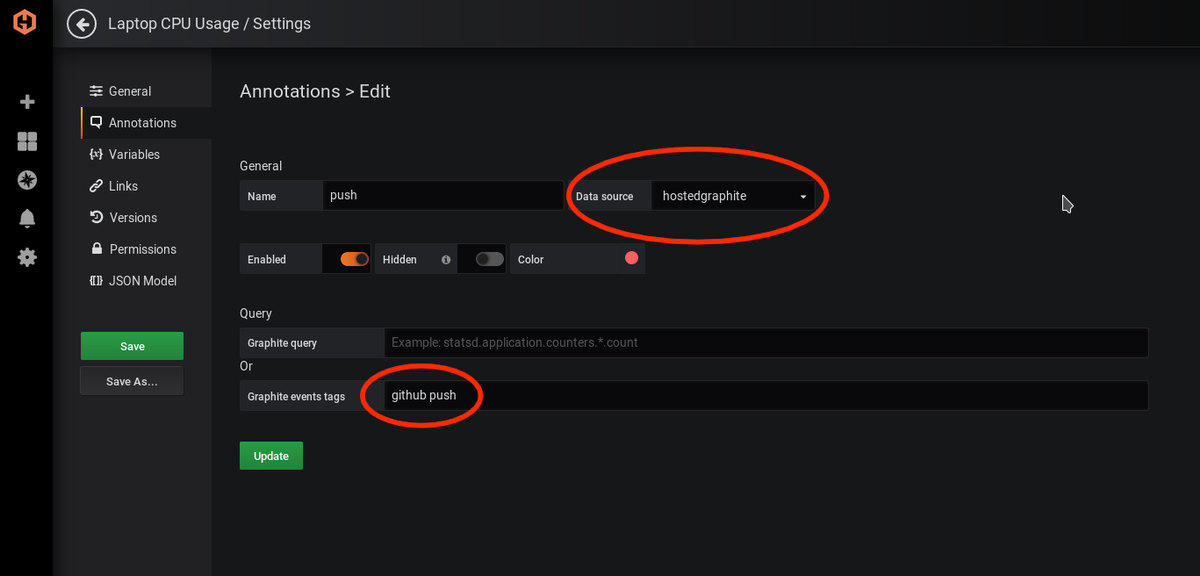
If you don’t know what data source you are pulling your graph from, you are probably using the default, which is MetricFire. The data source will be Hosted Graphite unless you specified a different data source when you started tracking your metrics. After that, you need to specify an event tag. You can add more event tags with comma separation, check the image below to see how to edit an annotation containing data from GitHub’s page and check the docs to see what tags can be used.
The Result
Since the dashboard is a timeline, the annotations should work regardless of a graph or not.
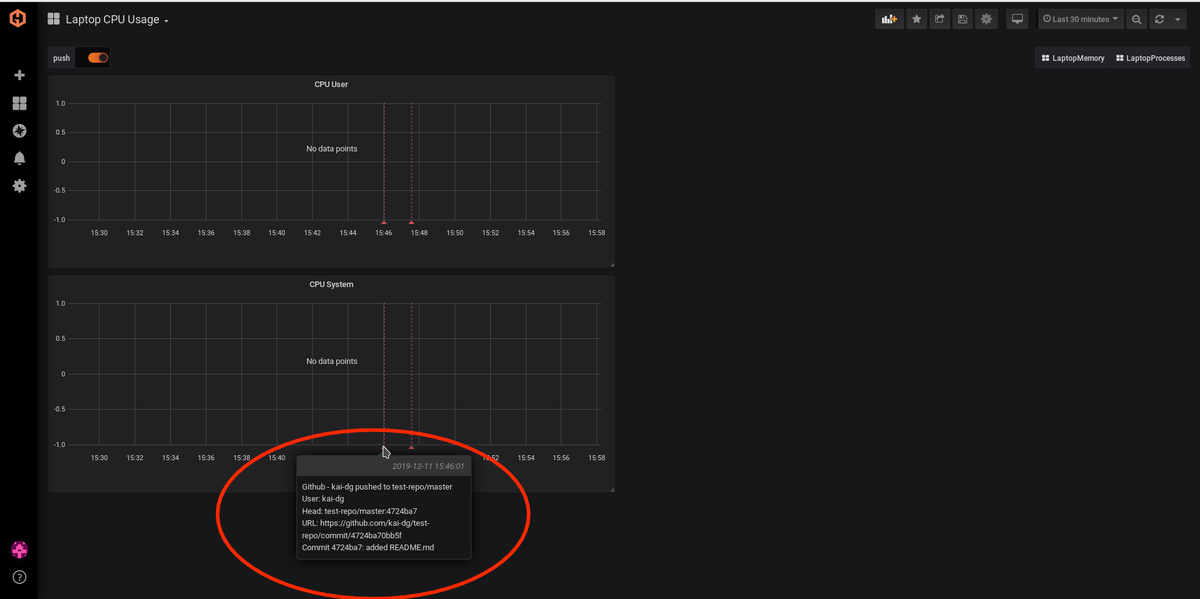
Now I can see when my website’s repository gets changed on the timeline of my webserver’s graph. If I am tracking the metrics of my memory and CPU usage, I can see how pushes have changed the amount of power and memory used by the server. On a larger scale, this could help optimize dozens of servers in a timely manner. A good takeaway from this article is also how to use a webhook, as it’s a powerful tool to integrate services easily.
Get to know our MetricFire better, and check out how MetricFire can fit into your monitoring environment! Get a free trial and start monitoring right away. Feel free to book a demo if you have questions about what Hosted Graphite can do for you.


