
Table of Contents
Great systems are not just built. They are monitored.
MetricFire runs Graphite and Grafana as a fully managed service for growing engineering teams, taking care of storage, scaling, and version updates so your team doesn't have to. Plans start at $19/month, billed per metric namespace rather than per host, and include engineer-staffed support. Integrations work natively with Heroku, AWS, Azure, and GCP, and data is stored with 3× redundancy in SOC2- and ISO:27001-certified data centres.
Introduction
SEO these days is no longer just about content because performance is a core part of how Google evaluates websites. Core Web Vitals, including Largest Contentful Paint (LCP), are now key signals used to measure real user experience and influence search visibility.
Since 2026, Google has tightened expectations and shifted how performance is measured. For example, they've replaced older metrics like First Input Delay (FID) with Interaction to Next Paint (INP), and are continuing to emphasize fast, stable page loads. For development teams, performance optimization is no longer a one-time task. At MetricFire, we've been working to stay ahead of Google's evolving changes by proactively improving LCP across our site. The goal was to reduce render-blocking resources and optimize how critical content loads on https://www.metricfire.com/ without affecting the existing UI.
After deploying some thoughtful updates, we validated the results using open-source tools (Hosted Graphite and Sitespeed). The outcome was clear: LCP improved by roughly 35%, along with measurable gains in other key performance metrics. In this post, we'll walk through what we changed, how we measured it, and what we learned.
1: Optimizing the Critical Rendering Path
The ask from the SEO side was pretty straightforward: improve page performance in a way that aligns with Google's Core Web Vitals, specifically LCP. We weren't reacting to a single bug or outage, this was about staying ahead of evolving performance expectations without taking on a large code refactor. So instead of chasing every possible optimization, we focused on changes that directly impact how quickly the main content renders. Looking at the pages, LCP was clearly tied to a combination of render-blocking CSS and how some hero assets were loaded. This basically meant that the browser was doing too much work before it could paint the main content. So from there, the approach was to simplify the critical rendering path as much as possible.
Key updates in our PR diff:
- Reduced render blocking CSS
Integration pages were loading a global homepage.css file that wasn't fully needed. Removing it reduced the amount of CSS the browser had to process before painting.
When this caused missing styles, we updated our import rules to pull in only the required styles. - Optimized the LCP image delivery to ensure the browser prioritizes and renders the LCP element faster
Our PR introduced a <picture> pattern with modern formats and better loading behavior:- AVIF and WebP sources with fallback
- explicit width and height
- fetchpriority="high"
- decoding="async"
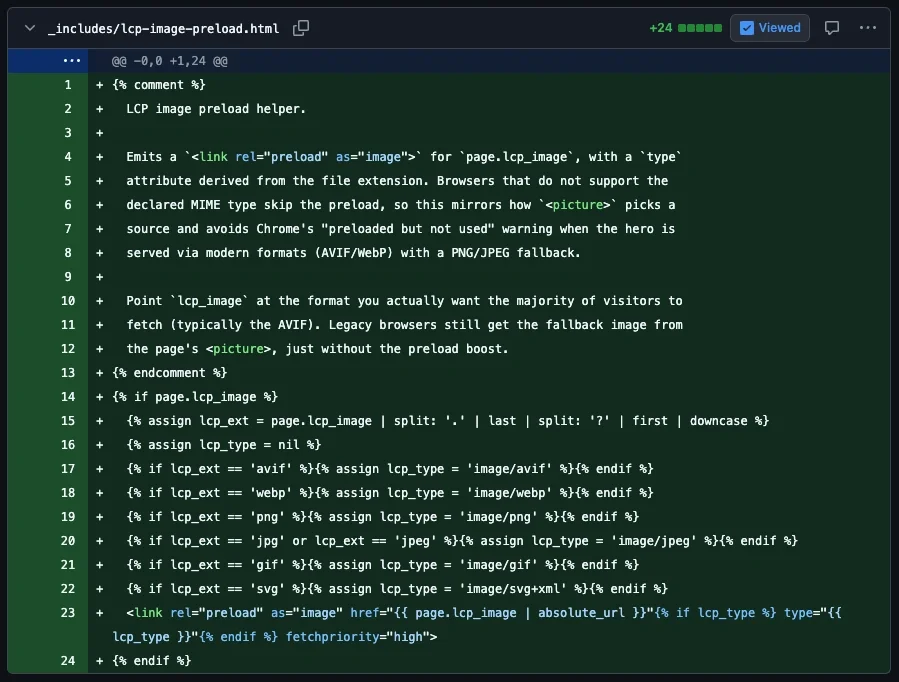
- Preloaded the LCP asset allowing the browser to fetch the critical asset earlier.
A helper was added to preload the LCP image using:<link rel="preload" as="image" fetchpriority="high">
- Deferred non-critical assets
Across the diff, non-essential work was pushed out of the initial render path:- deferred JavaScript execution
- lazy loaded non-critical images
- adjusted video loading behavior
None of these changes were large in isolation, the true impact came from focusing on the parts of the page that directly influence when the primary content becomes visible.
2: Measuring the Impact with Hosted Graphite and Sitespeed
After deploying these changes to the MetricFire site, the next step was to validate that they actually improved performance. Rather than relying on one-off checks, we used Sitespeed, an open source tool we recommend for testing site performance. The setup is very straightforward:
- Docker installed locally
- a Hosted Graphite account to obtain an API key
Sitespeed runs synthetic tests and sends metrics directly to a specified backend, where they can be visualized in dashboard tools (like Grafana). We ran Sitespeed via Docker and configured it to push performance metrics directly into one of our Hosted Graphite accounts:
docker run --rm -v "$(pwd)":/sitespeed.io sitespeedio/sitespeed.io:39.5.0 <FULL-SITE-URL> \
  -n 1 \
  --graphite.host carbon.hostedgraphite.com \
  --graphite.port 2003 \
  --graphite.namespace <HG-API-KEY>.sitespeed_io.default.hg
What we tracked
To evaluate the impact of the changes, we focused on a small set of Graphite metrics that were forwarded from running the Sitespeed test:
- LCP as the primary signal
- sitespeed_io.default.hg.pageSummary.<site_url>._.chrome.native.browsertime.statistics.timings.largestContentfulPaint.median
- FCP to confirm earlier rendering
- ...timings.firstContentfulPaint.median
- TBT to ensure no blocking regressions
- ...timings.totalBlockingTime.median
- CLS to verify layout stability
- ...pageinfo.cumulativeLayoutShift.median
- Speed Index for visual completeness
- ...visualMetrics.SpeedIndex.median
This kept the analysis focused on user-visible performance.
Comparing before and after
Because metrics were collected continuously, we were able to compare performance trends before and after deployment rather than relying on a single test run. To make this comparison clear, we added a deployment annotation directly on the dashboard. This creates a visual breakpoint that aligns the code changes with shifts in performance metrics.
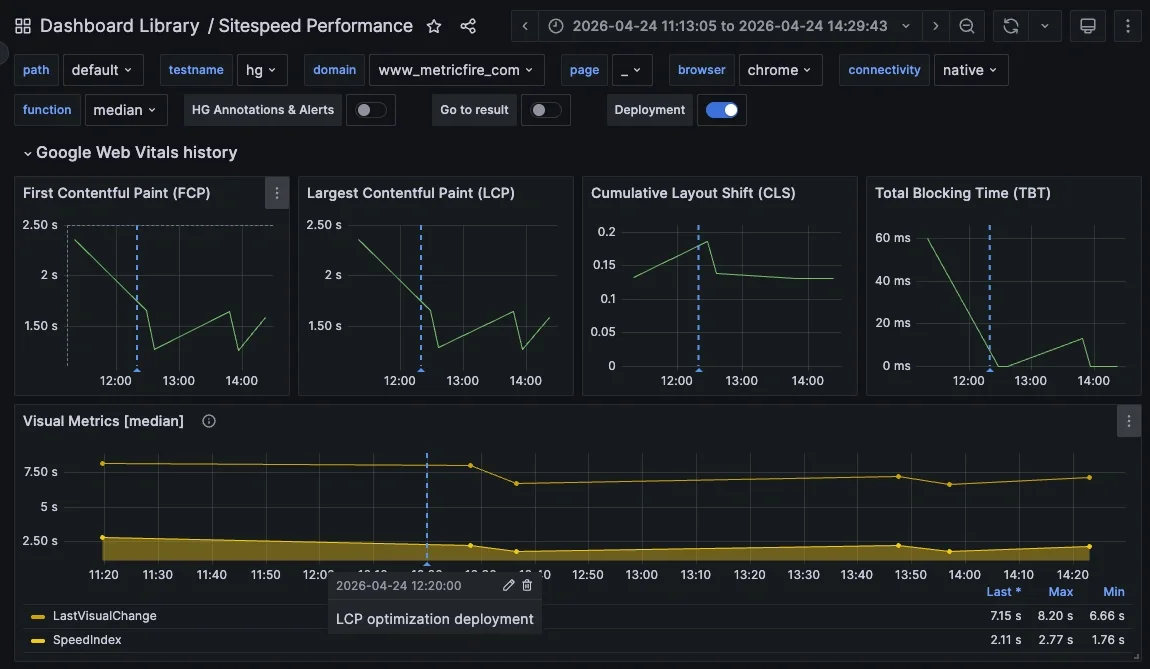
Looking at the data around the deployment marker, the improvement is immediate:
- LCP drops from roughly 2.3 to 2.4 seconds down to about 1.3 seconds shortly after deployment, then stabilizes around that lower range
- FCP follows a similar pattern, decreasing from about 2.3 seconds to 1.2 to 1.6 seconds
- TBT improves significantly, dropping from about 60 milliseconds to near 0 milliseconds, indicating less main thread blocking
- CLS remains stable, confirming that layout behavior was not negatively impacted
- Visual metrics like Speed Index also trend downward, showing faster overall visual completion
The key takeaway is not just the drop in individual values, but the consistency after deployment. Before the change, metrics were higher and more variable. After deployment, they settle into a lower, more stable range. This makes it easy to attribute the improvement to the changes made in the critical rendering path, rather than external factors or noise in the test runs.
3: Test Hosted Graphite and Sitespeed on Your Own Website
If you are working on performance improvements, the easiest way to understand their impact is to measure them directly.
Sitespeed is a free, open source tool that makes it easy to run repeatable performance tests against your site and all you need is Docker, which you probably already have. When paired with a storage backend like Graphite, you can track metrics over time and visualize changes as you deploy updates.
MetricFire offers a free trial of Hosted Graphite and Grafana, with no credit card required, so you can set this up quickly and start collecting data right away. Once metrics are flowing, you can build custom dashboards and alerts, track trends, and add annotations to correlate deployments with performance changes. Hosted Graphite even offers a 1-click auto-dash that will work instantly with the metrics you collect via Sitespeed:
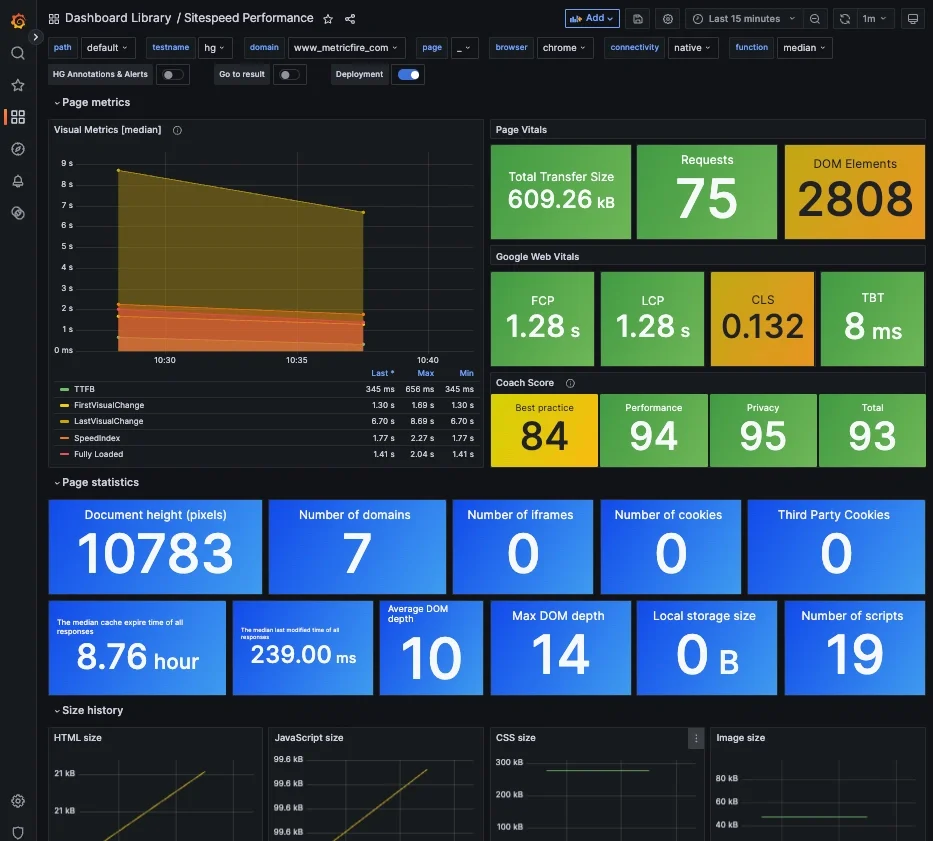
So instead of guessing whether a change improved performance, you can see exactly how it affects metrics like LCP in real time. Try Hosted Graphite and Grafana for FREE when you start a 14-day trial with MetricFire! Then just run a single Docker command to run tests against your website URL, and forward performance metrics to your HG account:
docker run --rm -v "$(pwd)":/sitespeed.io sitespeedio/sitespeed.io:39.5.0 <FULL-SITE-URL> \
  -n 1 \
  --graphite.host carbon.hostedgraphite.com \
  --graphite.port 2003 \
  --graphite.namespace <HG-API-KEY>.sitespeed_io.default.hg
Conclusion
Improving LCP does not require a full rewrite or a complete overhaul of your frontend. In this case, the biggest gains came from focusing on the critical rendering path and removing a few key bottlenecks. By reducing render blocking CSS, optimizing how the LCP image was loaded, and deferring non critical work, we were able to significantly improve how quickly the main content appears. The changes themselves were relatively small, but they were applied in the right places.
Just as important as the optimization update was validating the impact. Using Sitespeed and Hosted Graphite, we were able to track performance before and after our code deployment. This kind of workflow makes performance work more practical because instead of guessing or relying on one-off tests, you can continuously measure, iterate, and improve.
As Core Web Vitals continue to evolve, this approach becomes increasingly important. The goal is not just to meet a benchmark once, but to build a process that helps you stay ahead of it.
Sign up for the free trial and begin monitoring your infrastructure today. You can also book a demo and talk to the MetricFire team directly about your monitoring needs.