

Table of Contents
Great systems are not just built. They are monitored.
MetricFire runs Graphite and Grafana as a fully managed service for growing engineering teams, taking care of storage, scaling, and version updates so your team doesn't have to. Plans start at $19/month, billed per metric namespace rather than per host, and include engineer-staffed support. Integrations work natively with Heroku, AWS, Azure, and GCP, and data is stored with 3× redundancy in SOC2- and ISO:27001-certified data centres.
はじめに
PostgreSQLのデータベースパフォーマンスを監視することは、データベースが効率的に稼働し、遅延やダウンタイムなくアプリケーションをサポートするために不可欠です。これにより、パフォーマンスの低下を招く可能性のある遅いクエリ、リソースのボトルネック、およびデータベーススキーマの問題を特定することができます。また、事前の監視を行うことで、アプリケーションのニーズに合わせてデータベースを効果的に拡張できるようになり、全体的な信頼性とユーザー満足度の向上につながります。
本記事では、Telegrafエージェントを使用してPostgreSQLのパフォーマンスデータを収集し、任意のデータソースに転送する方法について詳しく解説します。
Telegrafエージェントの導入
Telegrafは、InfluxDB上に構築されたプラグイン駆動型のサーバーエージェントであり、データベース、システム、プロセス、デバイス、アプリケーションからメトリクスやイベントを収集・送信します。Go言語で記述されており、外部依存関係のない単一バイナリとしてコンパイルされるため、メモリ使用量を最小限に抑えられます。Telegrafは多くのOSに対応しており、さまざまなシステムパフォーマンスメトリクスを収集・転送するための便利な入力プラグインおよび出力プラグインを多数備えています。
Telegrafをインストール(Linux/RedHat)
/etc/telegraf/にインストールされます。wget https://dl.influxdata.com/telegraf/releases/telegraf_1.30.0-1_amd64.deb
sudo dpkg -i telegraf_1.30.0-1_amd64.deb
RedHat/CentOS
wget https://dl.influxdata.com/telegraf/releases/telegraf-1.30.0-1.x86_64.rpm
sudo yum localinstall telegraf-1.30.0-1.x86_64.rpm
出力先を設定
Telegrafは、Kafka、Graphite、InfluxDB、Prometheus、SQL、NoSQLなど、さまざまなデータソースへ出力するよう設定できます。
この例では、TelegrafをGraphite出力で設定します。まだデータソースをホストしていない場合は、Hosted Graphite by MetricFireの14日間無料トライアルを開始して、以下の手順を進めてください。
Hosted Graphiteアカウントを利用すると、データソースに加えて、アラート機能や可視化ツールとしてHosted Grafanaも利用できます。
Graphite出力を設定するには、ダウンロードしたTelegraf設定ファイル /etc/telegraf/telegraf.conf を任意のテキストエディタで開き、以下の変更を行います。
まず、以下の行のコメントアウトを解除します。
[[outputs.graphite]]
次に、server行のコメントアウトを解除し、以下のように編集します。
servers = ["carbon.hostedgraphite.com:2003"]
最後に、prefix行のコメントアウトを解除し、以下のように編集します。
prefix = "<YOUR_API_KEY>.telegraf"
まだHosted Graphiteアカウントをお持ちでない場合は、無料トライアルへ登録し、Hosted Graphite APIキーを取得してください。
また、別のデータソースへメトリクスを転送したい場合は、別のTelegraf出力設定を利用することも可能です。
PostgreSQL入力プラグインを設定
Telegrafには、多くの一般的な技術やサードパーティソースから幅広いデータを収集できる入力プラグインが多数用意されています。この例では、PostgreSQLプラグインの設定方法を紹介します。
まず、telegraf.conf ファイル内の inputs.postgresql セクションを探し、[[inputs.postgresql]] 行のコメントアウトを解除します。
[[inputs.postgresql]]
次に、アドレスURLを指定するか、localhost用の address 行のコメントアウトを解除します。
address = "host=localhost user=postgres sslmode=disable"
変更を保存した後、以下のコマンドを実行してTelegrafを起動し、設定エラーがないか確認します。
telegraf --config telegraf.conf注:Telegraf設定にデフォルトの user=postgres が含まれている場合は、DB内にも同じユーザーを作成する必要があります。
createuser -s postgres
これでTelegrafは、DBごと/ユーザーごとに約27種類のメトリクスをデータソースへ転送します。Graphite形式では、以下のように表示されます。
telegraf.<host>.postgres.host=localhost_user=postgres_.postgresql.blk_read_time
telegraf.<host>.postgres.host=localhost_user=postgres_.postgresql.blk_write_time
telegraf.<host>.postgres.host=localhost_user=postgres_.postgresql.blks_hit
telegraf.<host>.postgres.host=localhost_user=postgres_.postgresql.blks_read
telegraf.<host>.postgres.host=localhost_user=postgres_.postgresql.buffers_alloc
telegraf.<host>.postgres.host=localhost_user=postgres_.postgresql.buffers_backend
telegraf.<host>.postgres.host=localhost_user=postgres_.postgresql.buffers_backend_fsync
telegraf.<host>.postgres.host=localhost_user=postgres_.postgresql.buffers_checkpoint
telegraf.<host>.postgres.host=localhost_user=postgres_.postgresql.buffers_clean
telegraf.<host>.postgres.host=localhost_user=postgres_.postgresql.checkpoint_sync_time
telegraf.<host>.postgres.host=localhost_user=postgres_.postgresql.checkpoint_write_time
telegraf.<host>.postgres.host=localhost_user=postgres_.postgresql.checkpoints_req
telegraf.<host>.postgres.host=localhost_user=postgres_.postgresql.checkpoints_timed
telegraf.<host>.postgres.host=localhost_user=postgres_.postgresql.conflicts
telegraf.<host>.postgres.host=localhost_user=postgres_.postgresql.datid
telegraf.<host>.postgres.host=localhost_user=postgres_.postgresql.deadlocks
telegraf.<host>.postgres.host=localhost_user=postgres_.postgresql.maxwritten_clean
telegraf.<host>.postgres.host=localhost_user=postgres_.postgresql.numbackends
telegraf.<host>.postgres.host=localhost_user=postgres_.postgresql.temp_bytes
telegraf.<host>.postgres.host=localhost_user=postgres_.postgresql.temp_files
telegraf.<host>.postgres.host=localhost_user=postgres_.postgresql.tup_deleted
telegraf.<host>.postgres.host=localhost_user=postgres_.postgresql.tup_fetched
telegraf.<host>.postgres.host=localhost_user=postgres_.postgresql.tup_inserted
telegraf.<host>.postgres.host=localhost_user=postgres_.postgresql.tup_returned
telegraf.<host>.postgres.host=localhost_user=postgres_.postgresql.tup_updated
telegraf.<host>.postgres.host=localhost_user=postgres_.postgresql.xact_commit
telegraf.<host>.postgres.host=localhost_user=postgres_.postgresql.xact_rollback
PostgreSQL入力プラグインの詳細や追加の設定オプションについては、公式GitHubリポジトリを参照してください。
MetricFireのHosted Graphiteでカスタムダッシュボードとアラートを作成
MetricFireは、サーバー、データベース、ネットワーク、デバイス、アプリケーションなどからメトリクスを収集・可視化・分析・アラート通知できる監視プラットフォームです。MetricFireを使用することで、インフラ内の問題を簡単に特定し、リソースを最適化できます。MetricFireのHosted Graphiteは、監視環境を自前でホスティングする負担を取り除き、より重要な作業に時間と自由を使えるようにします。
このドット区切り形式はツリー構造のデータモデルを提供するため、メトリクスの検索やクエリが容易になります。
- Hosted Graphiteアカウントを作成し、上記の手順でTelegrafエージェントをサーバーに設定すると、メトリクスはHosted Graphiteバックエンドへ転送・タイムスタンプ付与・取り込み・集約されます。
- メトリクスは次のGraphite形式で送信・保存されます:metric.name.path <numeric-value> <unix-timestamp> これらのメトリクスはHosted Graphiteアカウント内で確認でき、カスタムアラートやGrafanaダッシュボードの作成に利用できます。
- これらのメトリクスはHosted Graphiteアカウント内で確認でき、カスタムアラートやGrafanaダッシュボードの作成に利用できます。
Hosted GraphiteのHosted Grafanaでダッシュボードを作成
Hosted Graphite UIで、Dashboards => Primary Dashboards に移動し、+ ボタンをクリックして新しいパネルを作成します。
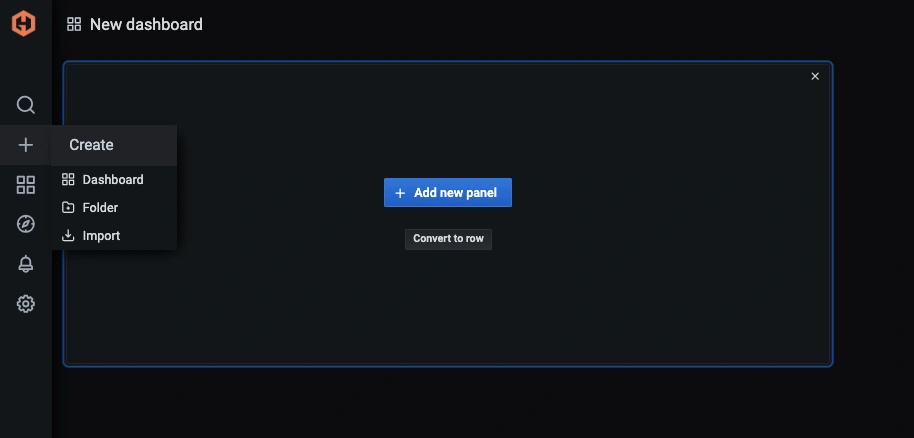
次に、クエリUIを使用してGraphiteメトリクスパスを選択します(Hosted Graphiteアカウント経由でGrafanaにアクセスしている場合、デフォルトのデータソースはHosted Graphiteバックエンドになります)。
Hosted Graphiteデータソースは、指定したパスに一致するすべてのメトリクスを取得するワイルドカード(*)検索にも対応しています。
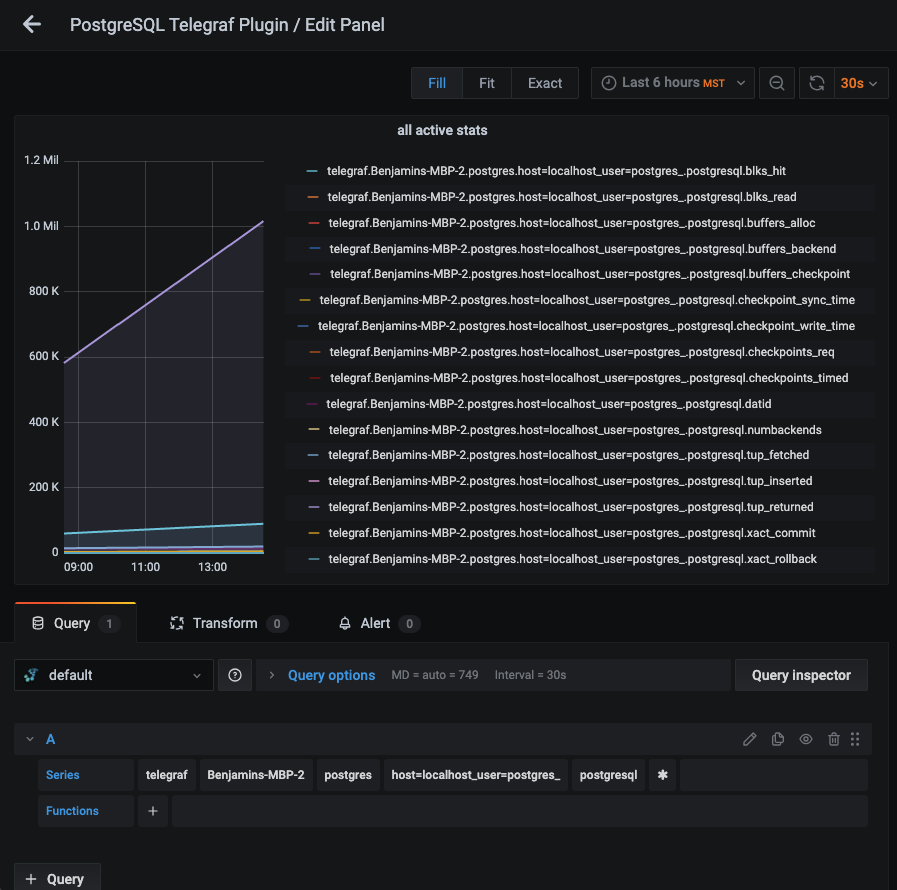
さらに、aliasByNode() のようなGraphite関数を使って、グラフ上のメトリクス名を見やすく整形できます。
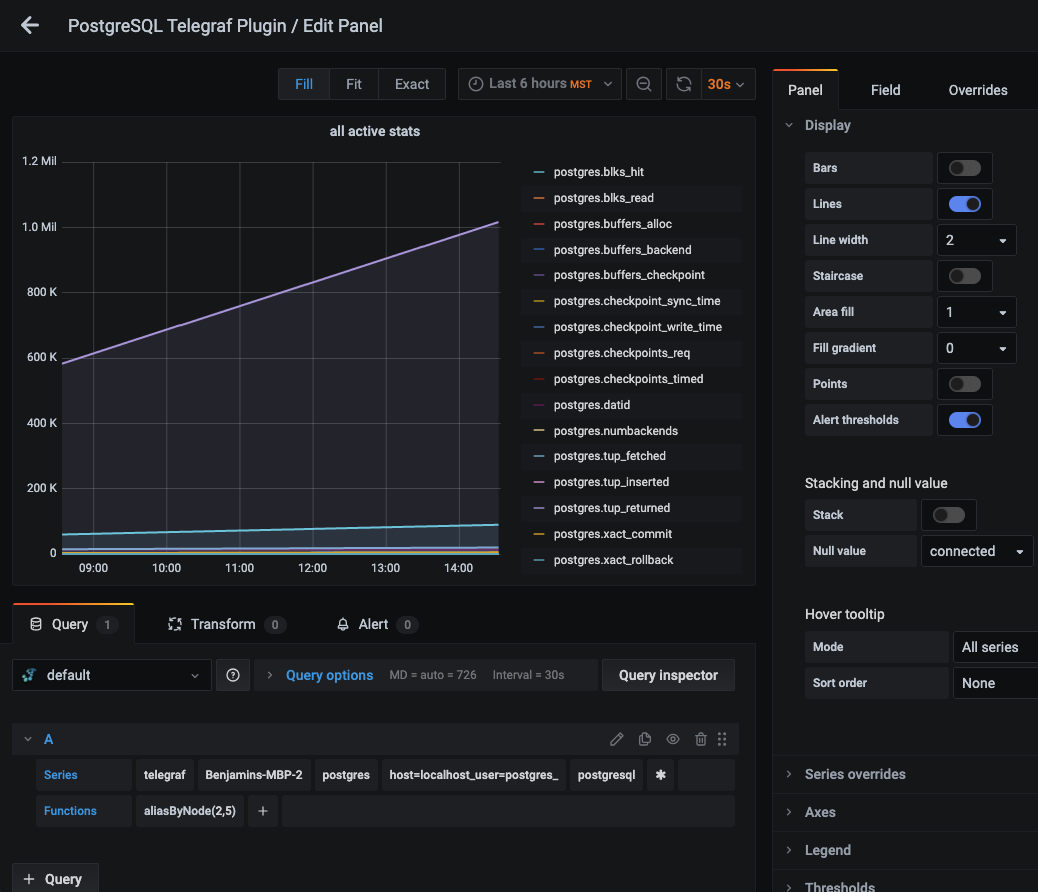
Grafanaにはそのほかにも、ダッシュボード変数やアノテーションの設定、さまざまな可視化形式の利用、表示設定の変更、単位設定など、多数の機能があります。
また、Hosted Graphiteには、Telegrafメトリクス向けの事前設定済みダッシュボードがDashboard Library内に用意されています。
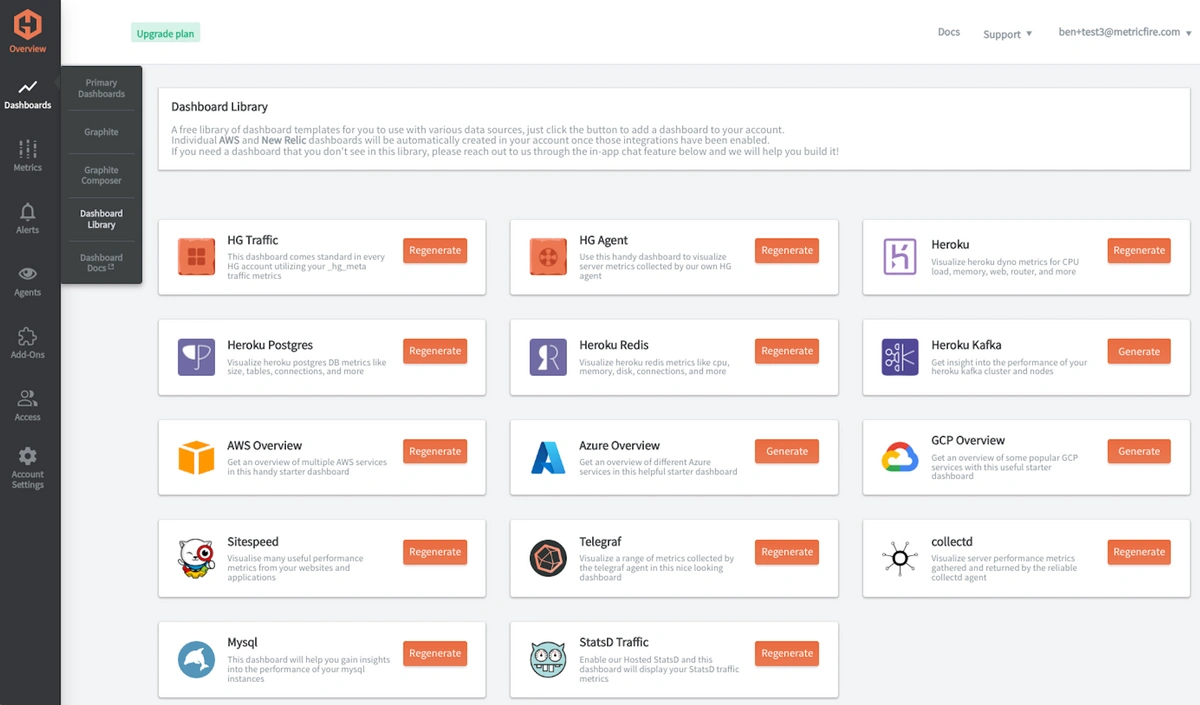
このダッシュボードをアカウントに生成すると、Primary Dashboards内から確認でき、CPU、メモリ、ディスクなどのシステムメトリクスを表示できます。
これらのシステムパフォーマンスメトリクスは、Telegraf→Graphite構成で標準的に収集されます。
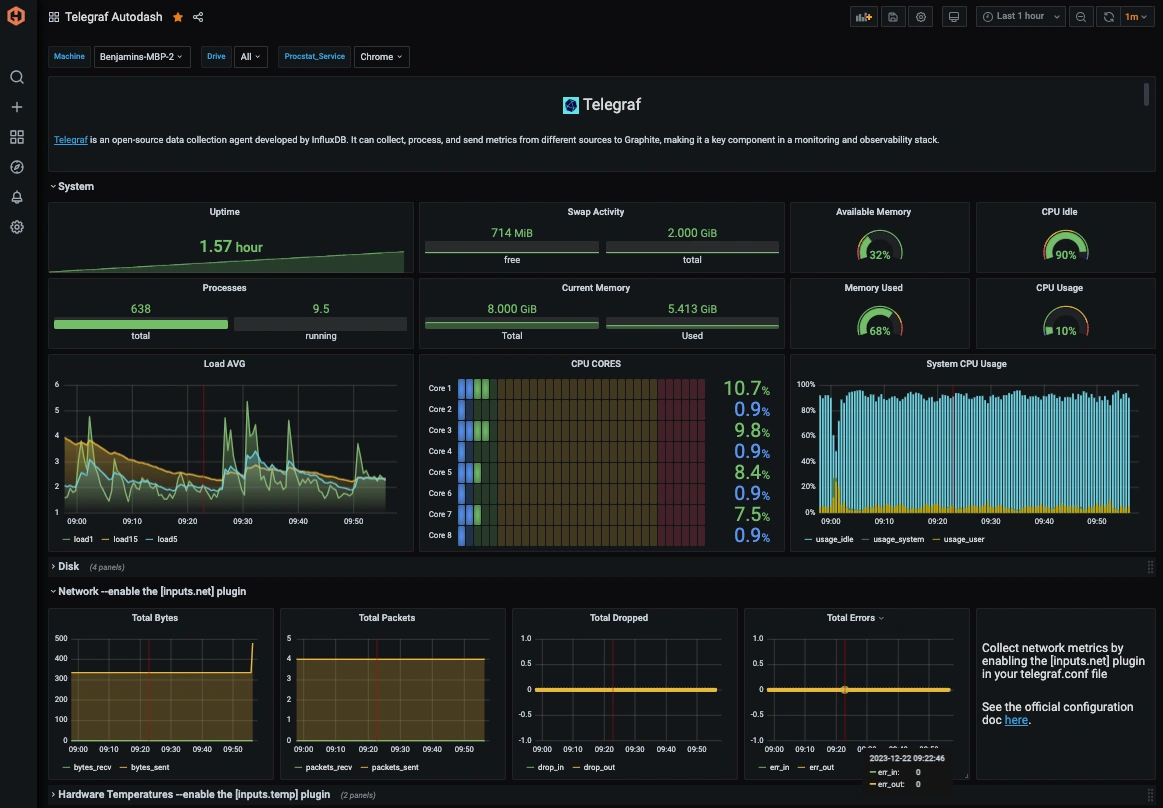
詳細については、Hosted Graphiteのダッシュボードドキュメントを参照してください。
Graphiteアラートを作成
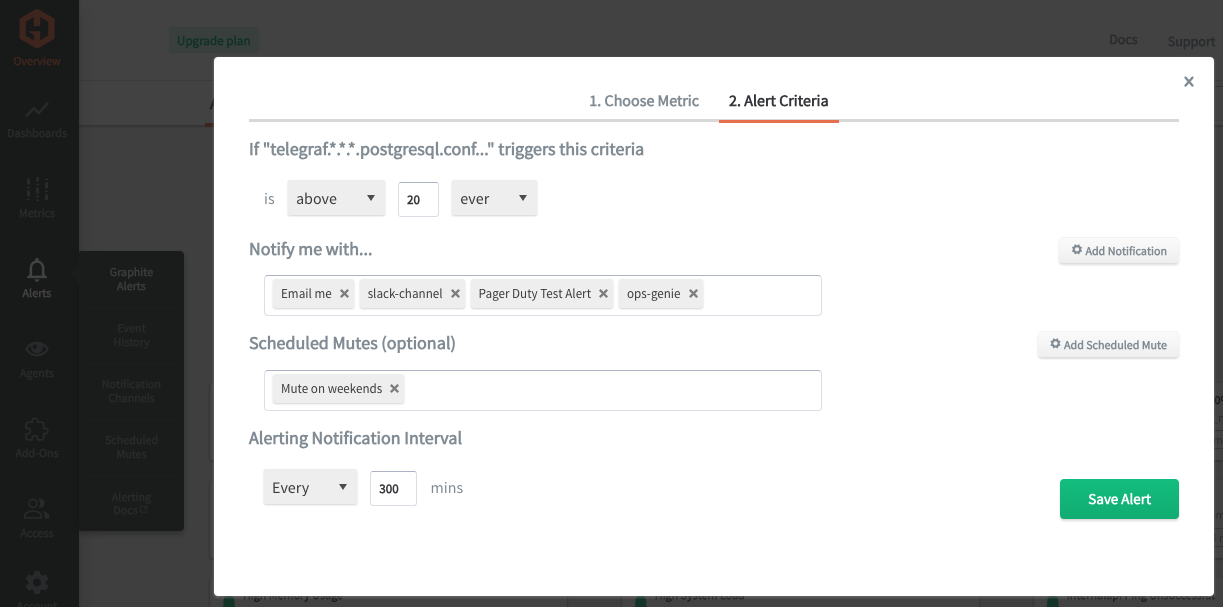
Hosted Graphite UIで、Alerts => Graphite Alerts に移動し、新しいアラートを作成します。アラート名を設定し、Graphiteメトリクスをアラート対象フィールドに追加し、このアラートの説明を入力します。
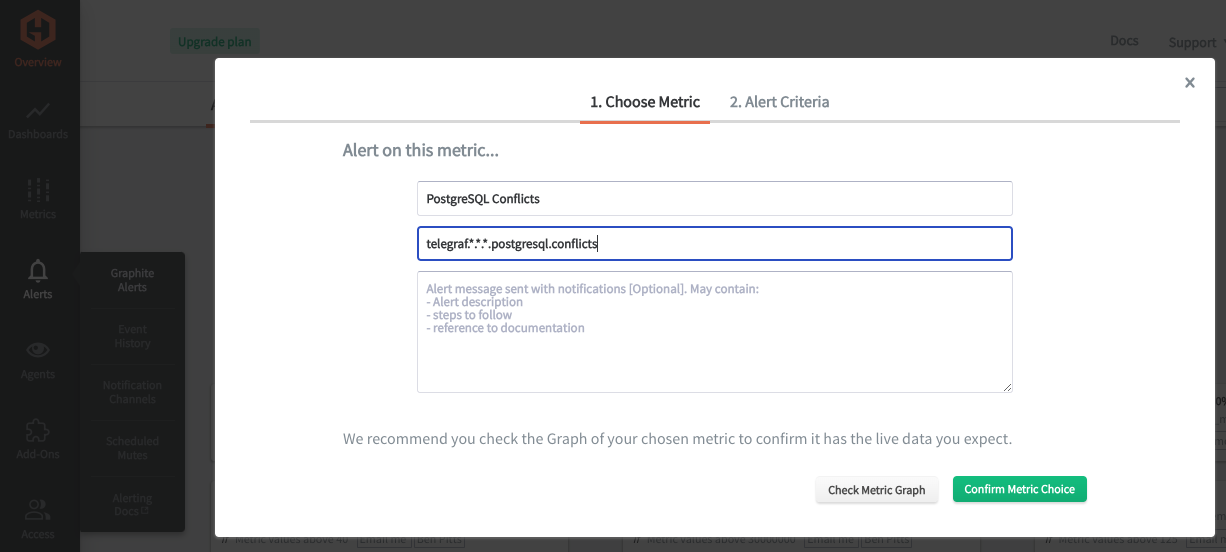
次に、Criteria タブでしきい値を設定し、通知チャネルを選択します。デフォルトの通知先はHosted Graphiteアカウント登録時のメールアドレスですが、Slack、PagerDuty、Microsoft Teamsなどの通知チャネルも簡単に設定できます。通知チャネルの詳細については、Hosted Graphiteの公式ドキュメントをご参照ください。
まとめ
データベース監視は、重要なデータ基盤の最適なパフォーマンス、信頼性、セキュリティを維持するために、企業にとって非常に重要です。リソース使用率、クエリパフォーマンス、システム状態などの主要メトリクスを追跡することで、企業は業務へ影響を与える前に潜在的な問題を事前に特定し、対処できます。監視は効率的なキャパシティプランニングも可能にし、企業が適切にリソースを拡張し、リソース不足によるダウンタイムを回避するのに役立ちます。また、データ整合性、セキュリティコンプライアンス、ユーザー満足度の確保にも重要な役割を果たします。さらに、時間の経過とともにパターンや傾向を分析することで、企業はデータベース最適化、コスト管理、戦略的計画に関する意思決定を行えるようになり、最終的には運用全体の安定性と成功につながります。
DBパフォーマンス監視は貴重なデータを提供しますが、ダッシュボードやアラートなどのツールを組み合わせることで、その価値はさらに高まります。これにより、リアルタイム可視化、問題の早期検知、過去トレンド分析、情報に基づいた意思決定が可能となり、堅牢かつ効率的なネットワークインフラを維持するために不可欠な要素を実現できます。
無料トライアルに登録して、今すぐPostgreSQLインスタンスの監視を試してみましょう。また、デモを予約し、監視ニーズについてMetricFireチームへ直接ご相談いただくことも可能です。