With Hosted Graphite, you are not stuck to your platform tool.
Hosted Graphite was built from the ground up to handle demanding systems that require high data points per second.
With Hosted Graphite, you save dev time and money because we control the servers with 3x redundant storage and hourly backups so you never lose your metrics.
Graphite is an industry-proven open-source monitoring solution. However, MetricFire is customized Graphite with a built-in agent, tagged metrics, and enterprise integrations.
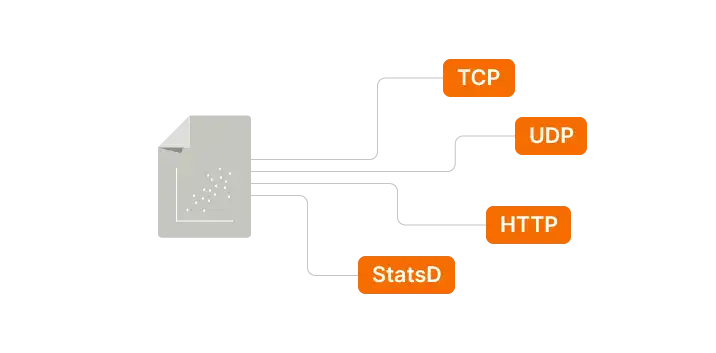
Use Hosted Graphite's APIs to modify, build, and automate within your code. Choose your protocol (TCP, UDP, HTTP, StatsD) on how you want to send metrics.
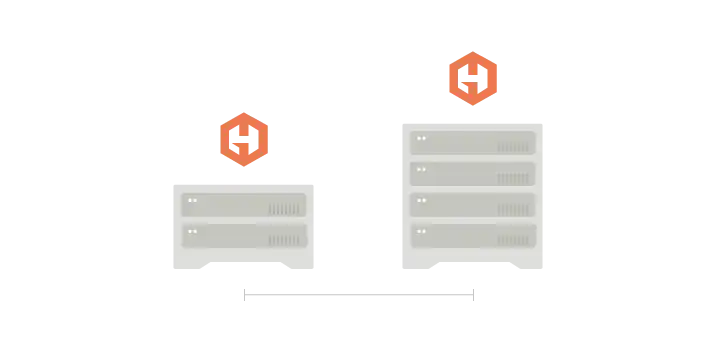
You shouldn't need to worry about monitoring solutions when your applications or systems grow. With Hosted Graphite, we scale when you scale.
MetricFire provides worldwide 24/7, 365 support so you are always up and running. We also offer setup and onboarding support so your team is in control.
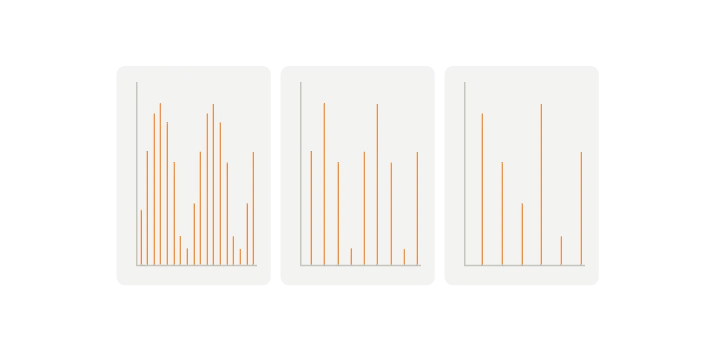
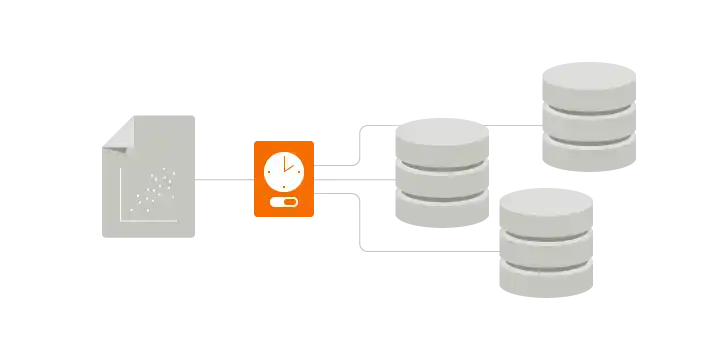
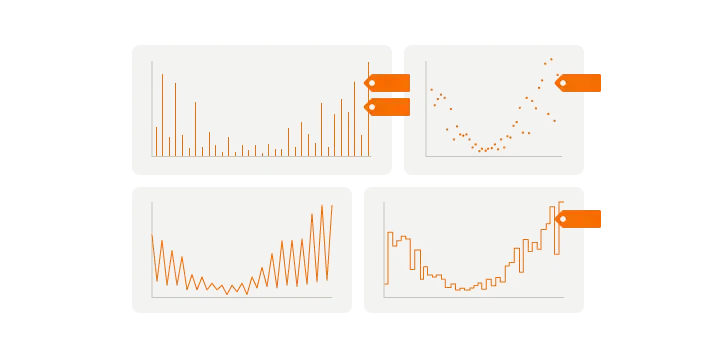
Hosted Graphite automatically produces different statistical views on your data (e.g.: obvs, min, max, sum) at 5 seconds, 30 seconds, 1 hour, and 1 day resolutions.
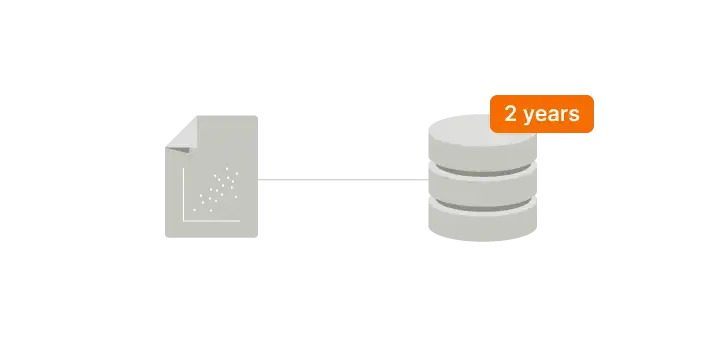
Storing 2 years of data can be costly. With Hosted Graphite, get insights into long-term trends with up to 2 years of storage.
A dedicated environment is critical for Enterprise DevOps teams. With Hosted Graphite, we can build a custom environment that fits your requirements.
With Hosted Graphite, you save dev time and money because we control the servers with 3x redundant storage and hourly backups so you never lose your metrics.
Graphite is an industry-proven open-source monitoring solution. However, MetricFire is customized Graphite with a built-in agent, tagged metrics, and enterprise integrations.
Use Hosted Graphite's APIs to modify, build, and automate within your code. Choose your protocol (TCP, UDP, HTTP, StatsD) on how you want to send metrics.
You shouldn't need to worry about monitoring solutions when your applications or systems grow. With Hosted Graphite, we scale when you scale.
MetricFire provides worldwide 24/7, 365 support so you are always up and running. We also offer setup and onboarding support so your team is in control.
Hosted Graphite automatically produces different statistical views on your data (e.g.: obvs, min, max, sum) at 5 seconds, 30 seconds, 1 hour, and 1 day resolutions.
Storing 2 years of data can be costly. With Hosted Graphite, get insights into long-term trends with up to 2 years of storage.
A dedicated environment is critical for Enterprise DevOps teams. With Hosted Graphite, we can build a custom environment that fits your requirements.

No vendor lock-in. Export your data because your data should be accessible.

Transparent pricing without the add-ons and custom metrics at no additional cost.

Efficient database to handle high cardinality data and tagged metrics.

Able to handle large data sets and data points per second without the extra costs.

Connect your own integrations or build your own integrations.

Since 2012, thousands of engineers place their trust in MetricFire.
Make the most of your engineers' valuable time to focus on building your product, rather than getting bogged down in running your monitoring solution.
Managing the servers needed for meaningful insights into your infrastructure can be a handful. Our infrastructure is built to scale with your demands.
Long-term metric storage can be time intensive and costly. With Hosted Graphite, we store your data for 2 years with 3 times the redundant storage.
For self-hosting, you are the support. Our expert engineers can help set up your monitoring system, troubleshoot and quickly resolve any issues.
From this video, you will learn how to monitor your use case by creating graphs with time series data (metric name, value, and time stamp).

Because our system is your system.
MetricFire runs Graphite and Grafana as a fully managed service for growing engineering teams, taking care of storage, scaling, and version updates so your team doesn't have to. Plans start at $19/month, billed per metric namespace rather than per host, and include engineer-staffed support. Integrations work natively with Heroku, AWS, Azure, and GCP, and data is stored with 3× redundancy in SOC2- and ISO:27001-certified data centres.
We host Graphite so you don’t have to! We handle and manage your metric collection, storage, alerting, and visualization services so you can focus on more important things.
Hosted Graphite provides ways for you to send data from your applications, servers, and infrastructure to plot that data on professional and easy-to-read custom dashboards.
We give you the tools you need to send large amounts of data and get accurate information back out, analyze it, alert on it, and share it. This alongside integrations with other popular services, account/team management options and offer great support.
You could self-host your monitoring and spend a few hours setting it up, send some test data, and feel good when the graphs start working. That’s the fun part. The less fun part comes later when scaling, version updates, or performance issues pull you away from real work and turn self-monitoring into a constant distraction. So we handle all of that for you and let your team focus on what actually matters.
We define a metric as a unique time-series metric namespace that is stored with our service. Sending updated counts for existing metrics in your account will not count as a new metric we bill on. We charge on the total number of unique metrics in an account, not the amount of data points the metric receives. Also, we do not bill separately between host (CPU) metrics, custom metrics, or tagged metrics - 1 metric is 1 metric.
This is the number of individual data points that are sent to each unique metric name space, per second. If you send a VERY high rate of DPPS, rate limiting or 'throttling' will be applied to protect the health of our systems.
If you have very heavy DPPS traffic, we can help you configure a pre-aggregation service for your metrics, like StatsD or carbon-c-relay.
When you sign up for a free trial, you get a full test of Hosted Graphite for 14 days including 500 total metrics, 5 user seats, alerts, dashboards, Hosted StatsD, logging options, and access to all integrations.
If you need help setting up a custom trial account for a PoC, please contact support@metricfire.com or book a call with us and we can help set this up for you.
Yes! You can share your dashboards with teammates, customers, or whoever you need. We don’t charge extra for this.
It takes about 60s for your metric data to be available for visualisation once it has been ingested and stored in our backend.
Yes, MetricFire supports Single Sign On (SSO) via SAML-enabled identity providers. Just reach out to us and we will enable this feature in your account, for free.
We understand there needs to be flexibility here. If you are consistently going over your metric limit, the data points that you are sending will be dropped.
We are happy to work with you as your monitoring partner so we’ll send you a message to offer support with managing your metrics, or help you find the plan level that suits you best.
Also, we have a dashboard and alerts automatically created in your account to let you know if you're getting close to your metric limit and if data points are being dropped.
Yes! We manage a Heroku Add-On and you can get dyno, router, postgres, redis, kafka, and process metrics with the HG Add-On, or with a dedicated Hosted Graphite account.
We provide email and live chat support for all plans and we answer quickly! Our team is made of experienced engineers committed to great service.
We are based in the USA but we have team members based in multiple countries so we can provide support during a wide range of hours. We provide support via email, live chat and technical support meetings.
We aggregate and store data at the following resolutions:
When querying data in your Dashboards, we map the following time spans to the following resolutions:
Yes, we support graphite tagging, have our own Tag API, and have a Tag Search UI feature so you can easily locate and manage your tagged metrics. Refer to our Graphite Tag doc for more details.
Yes! Our composite graphite alerting lets you combine multiple alert conditions (using AND / OR logic), so alerts trigger only when the full rule is satisfied.
Data is stored in ISO:27001 and SOC2 Certified Data centres located in Frankfurt, Germany. Metrics sent to us directly are stored on bare-metal database servers, provided by Hetzner. Learn more here.

We operate a distributed eventually-consistent database built upon open-source Riak. In case of failure, the workload is distributed and we store three redundant copies of all data at all aggregation resolutions. Queries will get back to the user with answers only when two different systems agree, which is also useful for fault tolerance. We also have backup, failover, and disaster recovery plans in place you never have to worry about data loss.