 +
+

To integrate Cisco 1000 Series Integrated Services Routers with MetricFire, please sign up for a free 14 day trial. We want to fully understand your requirements and monitoring goals, so we can advise you on how to obtain better visibility into your infrastructure. Please book a demo with us so we can show you how quick and easy it is to get meaningful data into your MetricFire account, and use that data to build custom dashboards and alerts.
MetricFire is a comprehensive monitoring and analytics platform that enables businesses to gain valuable insights into their network infrastructure and applications. It provides a wide range of tools and services designed to monitor, visualize, and analyze the performance of various components within an IT environment. One of the key integrations offered by MetricFire is with Cisco 1000 Series Integrated Services Routers (ISRs), which enables organizations to monitor and manage their Cisco router deployments effectively.
The Cisco 1000 Series ISRs are versatile, compact routers that provide secure connectivity and high-performance routing for small to medium-sized businesses. These routers offer a wide range of features, including advanced security, virtualization capabilities, and application optimization. With the integration of MetricFire, users can enhance the capabilities of Cisco 1000 Series ISRs by gaining real-time visibility and proactive monitoring of their network infrastructure.
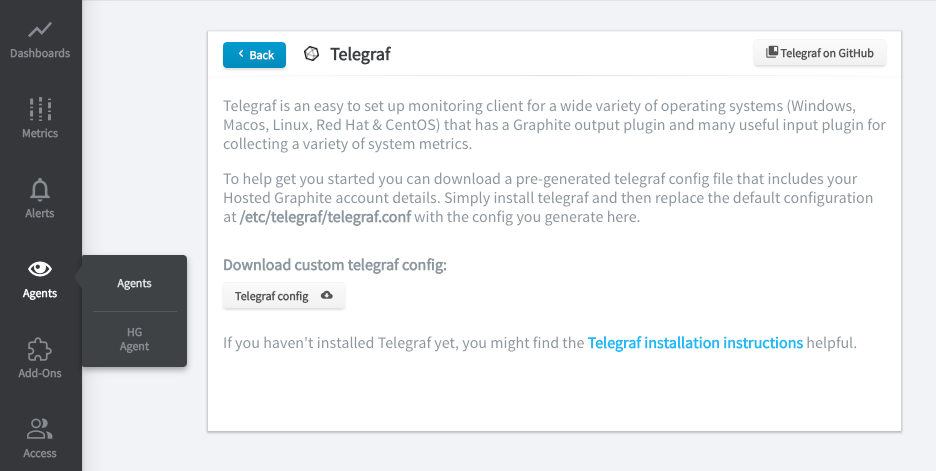
You can easily get insights from your Cisco devices with the Telegraf plugin by downloading a custom telegraf config in your Hosted Graphite account if you navigate to Agents => Telegraf. Then install telegraf using the steps outlined in our docs, and replace the default config with the custom config at the path that telegraf is installed at.
MetricFire's integration with Cisco 1000 Series ISRs allows for seamless collection and analysis of crucial performance metrics, providing administrators with valuable insights into the health and utilization of their router deployments. The integration process is straightforward, requiring minimal configuration and setup.
Once the integration is established, MetricFire collects and processes various performance data from Cisco 1000 Series ISRs, including CPU utilization, memory usage, network traffic, interface statistics, and more. This data is securely transmitted to the MetricFire platform, where it is stored and made available for visualization and analysis.
MetricFire offers a range of powerful visualization tools that allow users to create custom dashboards and reports to monitor and analyze the performance of their Cisco router infrastructure. These visualizations provide administrators with real-time and historical views of key metrics, enabling them to identify trends, troubleshoot issues, and optimize the performance of their network.
In addition to visualizations, MetricFire also provides alerting capabilities that can be configured to notify administrators when specific performance thresholds are breached. This proactive monitoring approach allows for timely responses to potential issues, ensuring that network operations remain smooth and uninterrupted.
Furthermore, MetricFire offers advanced analytics capabilities that enable users to derive deeper insights from their Cisco router data. By applying machine learning algorithms and statistical analysis, MetricFire can identify patterns, anomalies, and potential bottlenecks within the network infrastructure. This information can be used to make informed decisions about capacity planning, optimization, and resource allocation.
The integration of MetricFire with Cisco 1000 Series ISRs provides organizations with a comprehensive monitoring solution that enhances the performance, security, and reliability of their network infrastructure. By leveraging the capabilities of MetricFire, administrators can proactively monitor their Cisco routers, optimize performance, and ensure seamless connectivity for their business operations.
MetricFire's integration with Cisco 1000 Series Integrated Services Routers offers a powerful monitoring and analytics solution for organizations looking to gain real-time insights into the performance of their network infrastructure. With its intuitive visualization, alerting, and advanced analytics capabilities, MetricFire enables businesses to optimize their Cisco router deployments and ensure a smooth and efficient network operation.
MetricFire is a full-scale platform that provides infrastructure, system, and application monitoring using a suite of open-source tools. We will aggregate and store your data as time series metrics, which can be used to build custom dashboards and alerts. MetricFire takes away the burden of self-hosting your own monitoring solution, allowing you more time and freedom to work on your most important tasks.
MetricFire offers a complete ecosystem of end-to-end infrastructure monitoring, comprised of open-source Graphite and Grafana. MetricFire handles the aggregation, storage, and backups of your data, and offers alerting, team features, and API's for easy management of your monitoring environment. You can send server metrics using one of our agents, custom metrics from within your application code, and integration metrics from a variety of popular 3rd party services that we integrate with like Heroku, AWS, Azure, GCP, and many more!
Our Hosted Graphite product has improved upon standard Graphite to add data dimensionality, optimized storage, and offers additional tools and features that provide customers with a robust and well-rounded monitoring solution.
“We now have over ten times the amount of metrics we started with, and on different accounts. One of the great things about MetricFire is that scaling to support this increase has been hassle-free, requiring no additional work on our side.”
“Building and managing an on-premise installation at this scale would require a lot of engineer time, especially in the first year...we use this engineering time to work on initiatives closer to our core business”
“There’s complete transparency with everything MetricFire do which means we can accurately predict what we’ll be spending and comfortably keep within our budget.”
"Every time I have a question, I get an answer from support after just a couple of hours. Their technical knowledge is excellent.”
By integrating inventory stats with your other K8 performance metrics, you can better correlate... Continue Reading
Nagios is an open-source monitoring system used to track the performance and health of... Continue Reading