 +
+

To integrate GPU with MetricFire, please sign up for a free 14 day trial. We want to fully understand your requirements and monitoring goals, so we can advise you on how to obtain better visibility into your infrastructure. Please book a demo with us so we can show you how quick and easy it is to get meaningful data into your MetricFire account, and use that data to build custom dashboards and alerts.
GPUs aren't just for graphics anymore; they've become the workhorses of modern computing whenever massive process parallelism is needed. Unlike CPUs, which handle a few threads really well, GPUs are built to blast through thousands of operations at once, making them perfect for training AI models, running scientific simulations, or processing huge datasets. The trade-off is that all this horsepower comes with higher power draw, more heat, and memory systems that can bottleneck if you're not paying attention.
That's why GPU monitoring matters: without it, you can end up wasting resources by hitting thermal throttling or even pushing your hardware into failure.
In this guide, we'll walk through how to set up NVIDIA's DCGM Exporter to collect GPU metrics, and use Telegraf to scrape and forward them to MetricFire for storage and visualization.
Telegraf is a plugin-driven server agent built on InfluxDB, and can be used for collecting and sending statistics from servers, databases, processes, devices, and a range of 3rd party technology platforms. It is compatible with most operating systems and has many useful output plugins and input plugins for collecting and forwarding a wide variety of performance metrics.
Especially popular for GPU servers that ship with NVIDIA's System Management Interface (SMI), a built-in command-line tool for checking performance and health stats. Popular GPUs to use include the Titan Series GPUs (Titan RTX, Titan V, Titan Xp) and the RTX 30XX Series GPUs (RTX 3060, RTX 3070, RTX 3080, RTX 3090).
Follow these steps to get started:
Use MetricFire's Hosted Graphite platform to analyze your system's performance and troubleshoot errors. Book a demo with our team for more detailed information about MetricFire and how to integrate it with your system; sign up for a MetricFire free trial to get started with seeing your GPU's vital signs.
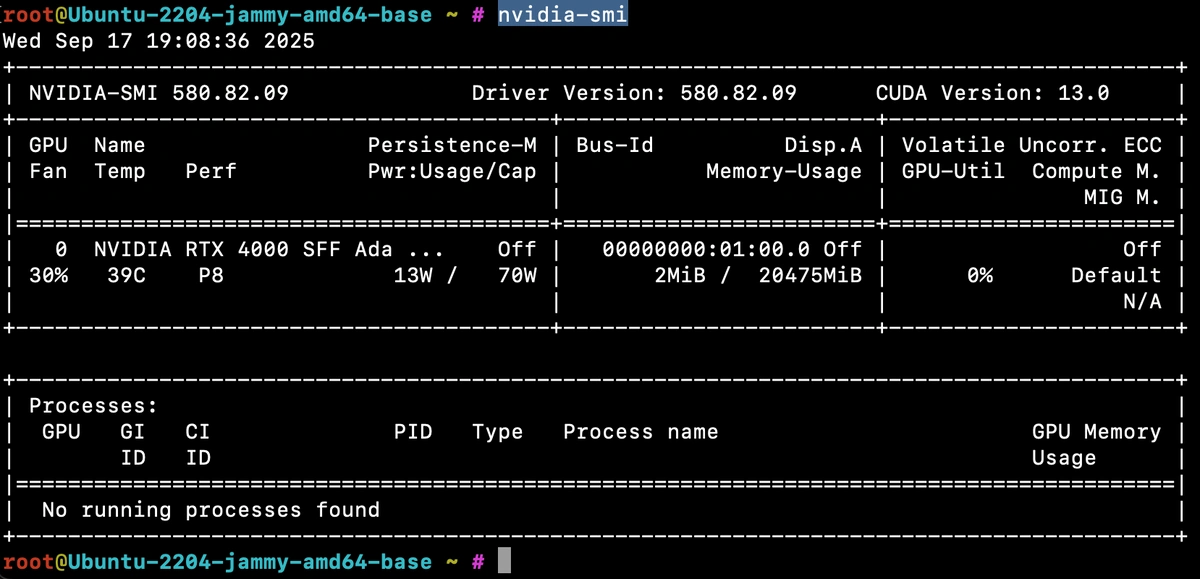
Most GPU servers ship with NVIDIA's System Management Interface (SMI), a built-in command-line tool for checking performance and health stats. Popular GPUs that include this include the Titan Series (Titan RTX, Titan V, Titan Xp) and the RTX 30XX Series (RTX 3060, RTX 3070, RTX 3080, RTX 3090).
Running nvidia-smi shows you real-time usage details like GPU utilization, memory consumption, temperature, and power draw—it's the quickest way to confirm your GPU is alive and working.
For testing, we spun up a Hetzner GEX44 GPU server (running Ubuntu 22.04) and used it to explore how to capture and visualize GPU metrics for long-term performance tracking.
While SMI is great for spot checks, it doesn't provide a continuous stream of metrics for dashboards and alerts. That's where NVIDIA DCGM (Data Center GPU Manager) comes in—it exposes the same low-level telemetry over an HTTP endpoint that can be scraped by Telegraf, OpenTelemetry, or Prometheus, and stored in MetricFire's Hosted Graphite backend for long-term monitoring.
NVIDIA's Data Center GPU Manager (DCGM) is a low-level toolkit for monitoring and managing GPUs in server environments. It exposes detailed telemetry—utilization, memory, temperature, power, reliability counters—that you wouldn't get from a simple spot-check tool like nvidia-smi.
On its own, DCGM provides the runtime and APIs to access GPU stats. When paired with the DCGM Exporter, those metrics are made available over HTTP in Prometheus format so they can be scraped by collectors like Telegraf, OpenTelemetry, or Prometheus itself.
Add the NVIDIA CUDA/DCGM repo which installs NVIDIA's keyring and adds their official repository, so apt can fetch packages on Ubuntu 22:
wget https://developer.download.nvidia.com/compute/cuda/repos/ubuntu2204/x86_64/cuda-keyring_1.1-1_all.deb

sudo dpkg -i cuda-keyring_1.1-1_all.deb
sudo apt-get update
Install DCGM runtime to provide the low-level host engine and libraries that expose GPU stats. It's required by dcgm-exporter to talk to the NVIDIA driver and collect metrics:
sudo apt-get install -y datacenter-gpu-manager
Install and start DCGM-Exporter (via Snap). The exporter runs a small HTTP server on port 9400, exposing GPU stats in the Prometheus format so collectors (like Telegraf) can scrape them:
sudo snap install dcgm
sudo snap start dcgm.dcgm-exporter
Verify the metrics endpoint to confirm that the exporter is running by querying the metrics endpoint. You will see GPU temperature, power usage, clock speeds, and more:
curl localhost:9400/metrics | head -20
If you don't already have an instance of Telegraf running in your server, install our handy HG-CLI tool to quickly install/configure Telegraf:
curl -s "https://www.hostedgraphite.com/scripts/hg-cli/installer/" | sudo sh
NOTE: You will need to input your Hosted Graphite API key, and follow the prompts to select which metric sets you want. The CLI tool automatically configures the output to your Hosted Graphite account!
Once it's installed, open the Telegraf configuration file at: /etc/telegraf/telegraf.conf and add the following section so Telegraf scrape the metrics endpoint:
[[inputs.prometheus]]
  urls = ["http://localhost:9400/metrics"]
Simply save your updated conf file and restart the Telegraf service to forward the GPU performance metrics to your HG account. Or run it manually to inspect the output for potential syntax/permission errors:
telegraf --config /etc/telegraf/telegraf.conf
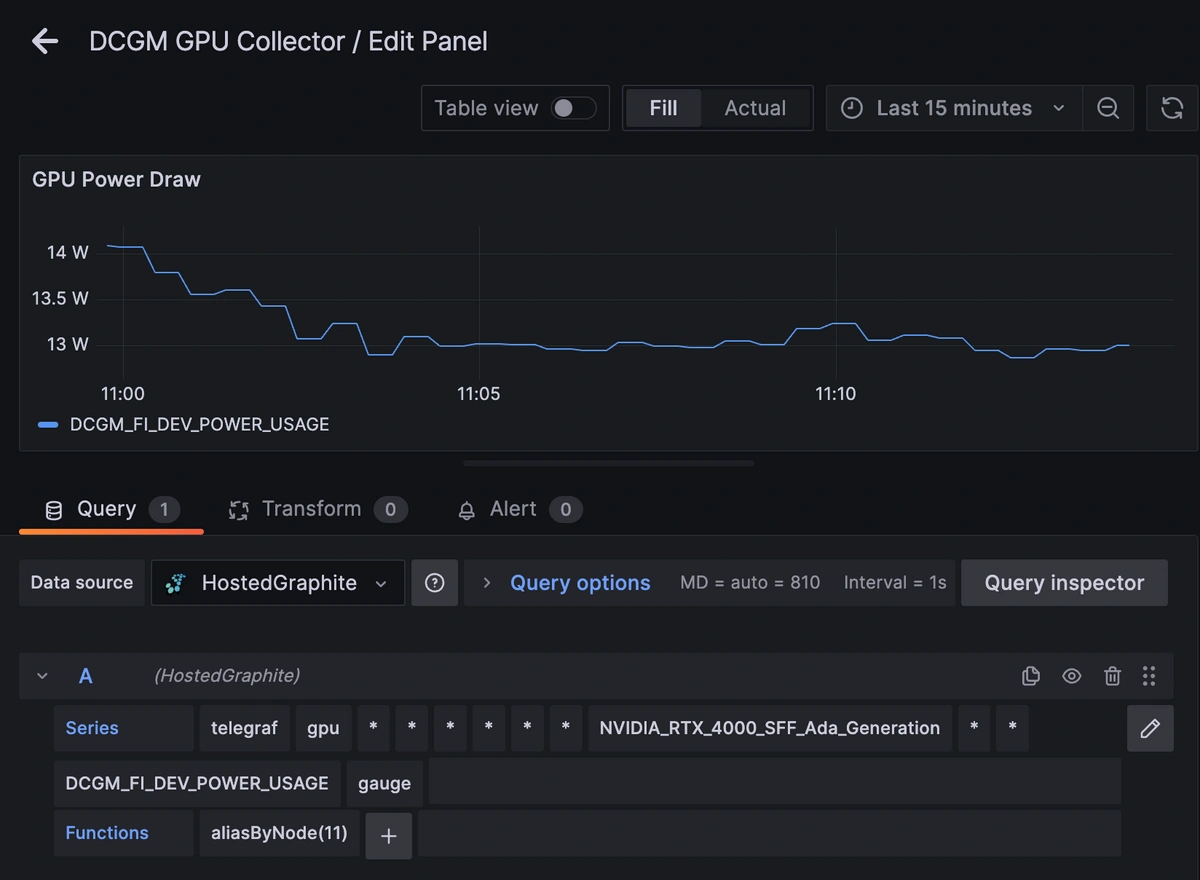
Once these metrics hit your Hosted Graphite account, you can use them to create custom dashboards and alerts!
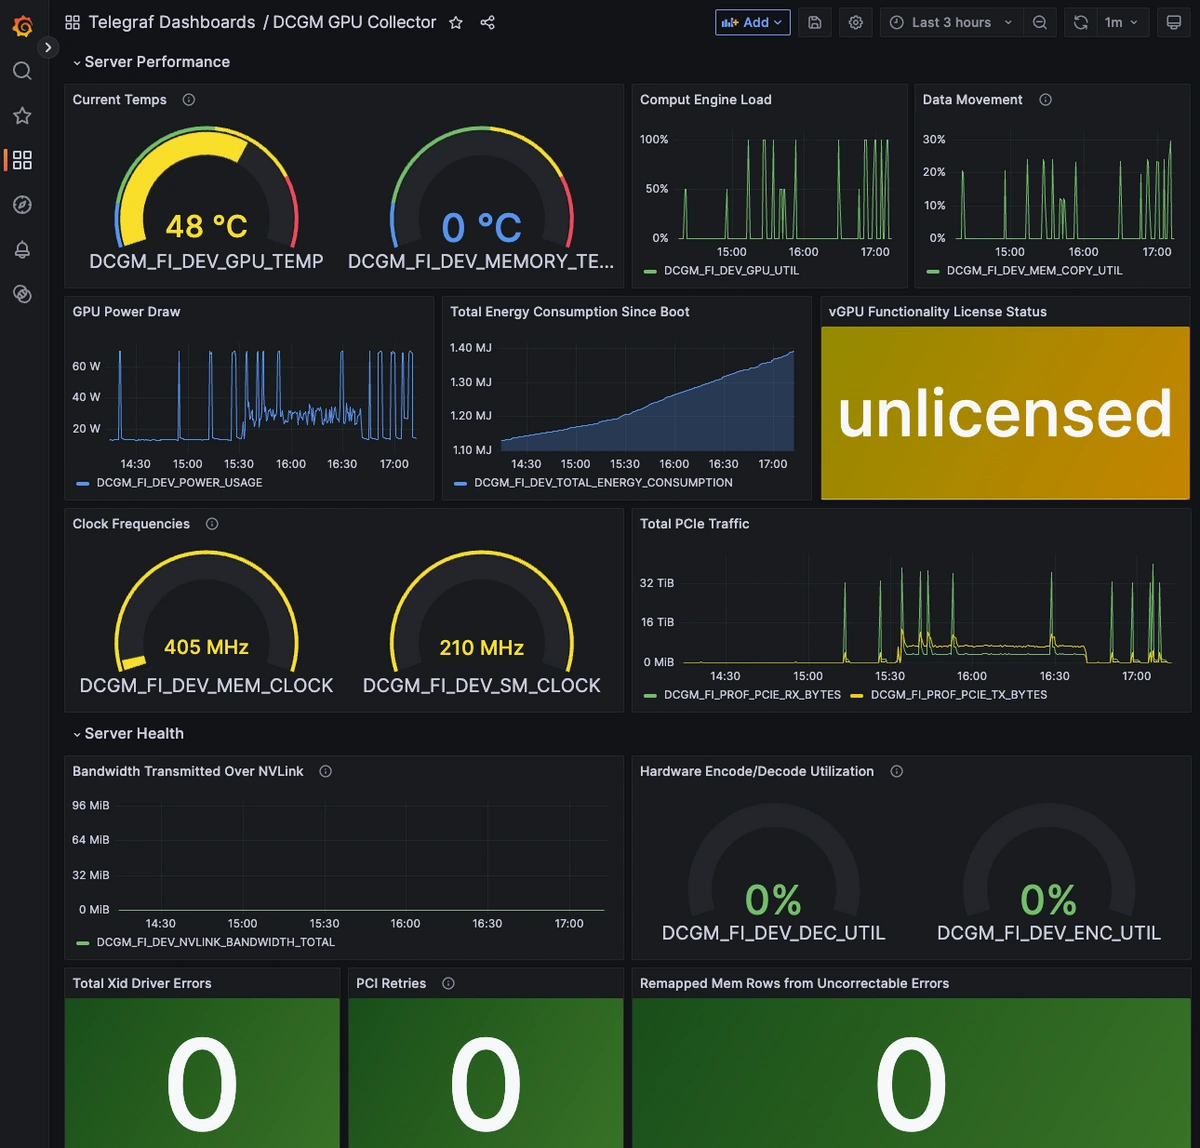
Once your metrics are in Hosted Graphite, log in to Grafana and start building GPU performance dashboards.
Explore MetricFire Grafana dashboards
Learn more about Telegraf integration
Once the DCGM exporter is up and running, you'll see a wide range of GPU metrics automatically collected and forwarded to the Hosted Graphite backend. These cover utilization, memory, thermal, power, bandwidth, and even hardware health indicators. Below is an overview of the most useful default metrics that will be collected, along with what each represents and its unit of measurement.
| Metric | Description | Unit |
|---|---|---|
| DCGM_FI_DEV_GPU_UTIL | Core GPU compute engine load | % |
| DCGM_FI_DEV_POWER_USAGE | Current GPU power draw | W |
| DCGM_FI_DEV_GPU_TEMP | GPU core temperature | °C |
| DCGM_FI_DEV_MEMORY_TEMP | VRAM module temperature | °C |
| DCGM_FI_DEV_FB_USED | VRAM currently in use | MiB |
| DCGM_FI_DEV_XID_ERRORS | Fatal driver-reported error count | count |
| DCGM_FI_DEV_*_REMAPPED_ROWS | Memory health indicators | count |
Metrics like remapped rows, PCIe replay counters, and Xid errors are designed as health indicators rather than performance metrics. On a healthy GPU, these values should stay at 0. A nonzero value means the hardware had to correct or retry something it shouldn't have to (like memory rows were remapped due to ECC faults, or PCIe packets were retried due to transmission errors). If you see these counters incrementing, it's a sign of underlying instability like failing VRAM, an unreliable PCIe bus, or a deeper hardware/driver fault. In production, these are "red flag" metrics so any nonzero value warrants investigation.
Set alerts to detect early signs of degradation:
dcgm-exporter is running, and the DCGM runtime matches your driver version.gpu-burn is a CUDA-based stress test that pushes the GPU to 100% utilization. It's commonly used for burn-in testing and validating stability under heavy load.
First, install build tools and CUDA toolkit that is required for compilation:
sudo apt-get update
sudo apt-get install -y git make gcc nvidia-cuda-toolkit
Then, clone the gpu-burn repository and compile the binary:
git clone https://github.com/wilicc/gpu-burn.git
cd gpu-burn
make
Finally, run gpu-burn for 2 min (adjust duration as needed):
./gpu_burn 120
While running, you'll see spikes in GPU utilization, power draw, and temperature in your DCGM metrics.
GPUs are among the most power-hungry components in modern compute infrastructure. Unlike CPUs, which idle down aggressively, GPUs maintain a higher baseline draw just to keep cores and memory ready. Under load, they can spike toward their thermal design power (TDP) hundreds of watts to sustain thousands of parallel compute cores and high-bandwidth VRAM simultaneously. Even at idle, memory refresh cycles and driver management consume measurable energy. Over time, that translates into large cumulative energy use, which is exactly what your DCGM energy counter is reporting.
MetricFire is a full-scale platform that provides infrastructure, system, and application monitoring using a suite of open-source tools. We will aggregate and store your data as time series metrics, which can be used to build custom dashboards and alerts. MetricFire takes away the burden of self-hosting your own monitoring solution, allowing you more time and freedom to work on your most important tasks.
MetricFire offers a complete ecosystem of end-to-end infrastructure monitoring, comprised of open-source Graphite and Grafana. MetricFire handles the aggregation, storage, and backups of your data, and offers alerting, team features, and API's for easy management of your monitoring environment. You can send server metrics using one of our agents, custom metrics from within your application code, and integration metrics from a variety of popular 3rd party services that we integrate with like Heroku, AWS, Azure, GCP, and many more!
Our Hosted Graphite product has improved upon standard Graphite to add data dimensionality, optimized storage, and offers additional tools and features that provide customers with a robust and well-rounded monitoring solution.
“We now have over ten times the amount of metrics we started with, and on different accounts. One of the great things about MetricFire is that scaling to support this increase has been hassle-free, requiring no additional work on our side.”
“Building and managing an on-premise installation at this scale would require a lot of engineer time, especially in the first year...we use this engineering time to work on initiatives closer to our core business”
“There’s complete transparency with everything MetricFire do which means we can accurately predict what we’ll be spending and comfortably keep within our budget.”
"Every time I have a question, I get an answer from support after just a couple of hours. Their technical knowledge is excellent.”
DogStatsDは便利な一方でベンダーロックインの原因にもなります。本記事ではTelegrafを使い、既存のDogStatsD計測を維持したままDatadog依存を減らし、他の監視バックエンドへ移行する方法を解説します。 Continue Reading
本記事では、DCGM Exporterのインストール方法、/metricsのスクラップ方法、Grafanaでの可視化方法、そして電力、エラー、使用率に関するアラートの設定方法を解説しています。 Continue Reading