Hosted Graphiteを使用すれば、監視プラットフォームの
ツールに縛られることはありません。
Hosted Graphiteは、1秒あたりの高いデータポイントを必要とする厳しいシステムを
処理するために、ゼロから構築されました。
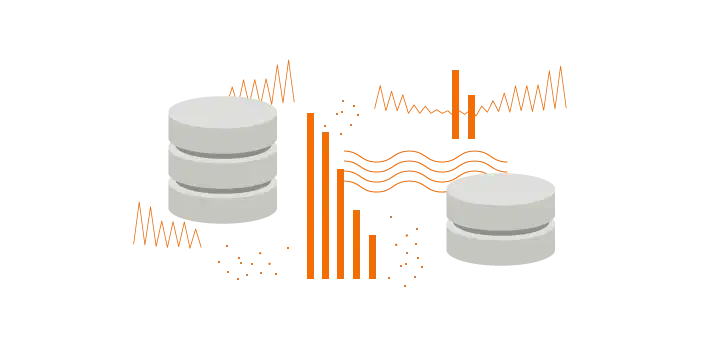
MetricFireのHosted Graphiteを使用すると、3倍の削減ストレージと1時間ごとの
バックアップでサーバーを制御するため、開発者の時間とお金を大幅に節約できます。
Graphiteは、業界が実証したオープンソース監視ソリューションです。ただし、MetricfireでカスタマイズされたHosted Graphiteには内蔵エージェント、タグ付き
メトリック、およびエンタープライズ統合を備えられています。
Hosted GraphiteのAPIを使用して、コード内の変更、構築、自動化を行います。
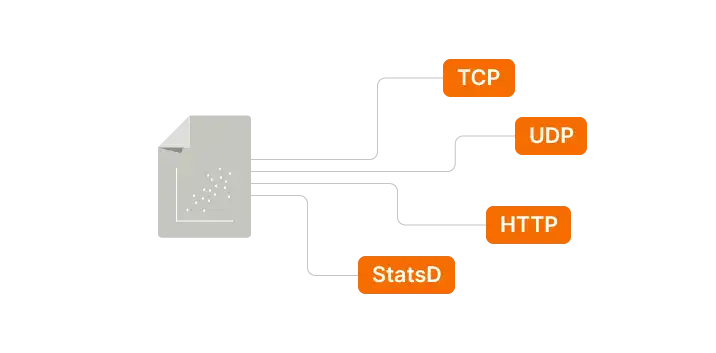
メトリクスを送信するプロトコル(TCP、UDP、HTTP、StatsD)を選択します。
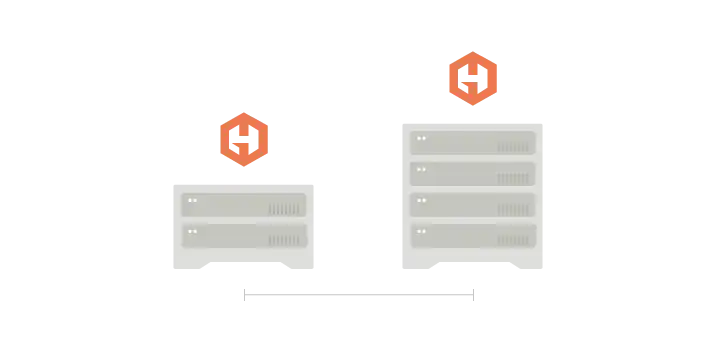
アプリケーションやシステムが大きく成長したときでも、監視ソリューションを
心配する必要はありません。Hosted Graphiteの使用でスケーリングが
容易に可能となります。
Metricfireは世界中の24時間年中無休でサポートを提供するため、監視ソリューション
は常に稼働しています。また、全てのチームにセットアップとオンボーディングの
サポートも提供しています
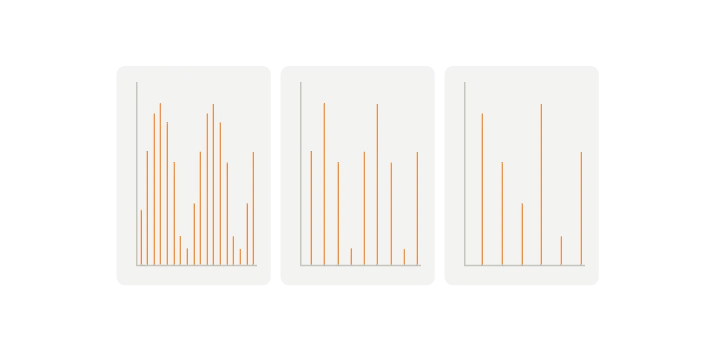
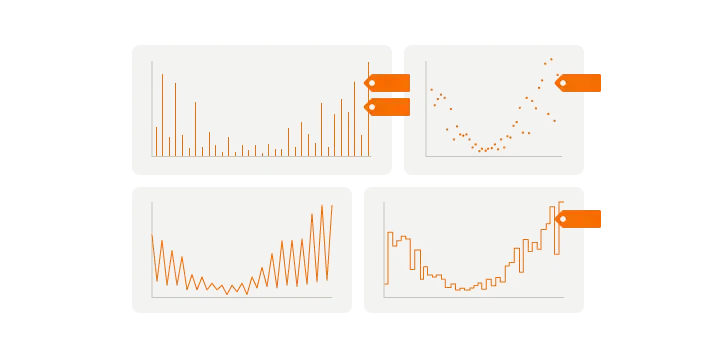
Hosted Graphiteは、5秒、30秒、1時間、1日の単位で、データ(obvs、min、max、sumなどを含む)の異なる統計ビュー(obvs、min、max、sumなどを含む)
を自動的に生成します。
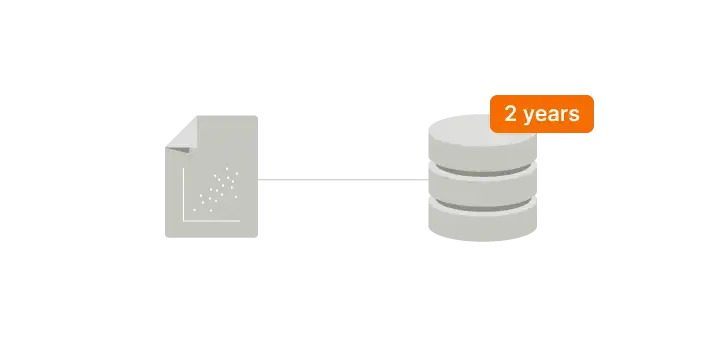
2年間のデータを保存するには、コストがかかり、小さなチームにとっては大きな
重荷となります。Hosted Gaphiteを使用して、最大2年間の長期保管で長期的な
傾向について洞察を得れるようになります。
エンタープライズのDevOpsチームにとって専用環境は非常に重要です。
Hosted Graphiteでは、お客様の要件に合ったカスタム環境を構築できます。
MetricFireのHosted Graphiteを使用すると、3倍の削減ストレージと1時間ごとの
バックアップでサーバーを制御するため、開発者の時間とお金を大幅に節約できます。
Graphiteは、業界が実証したオープンソース監視ソリューションです。ただし、MetricfireでカスタマイズされたHosted Graphiteには内蔵エージェント、タグ付き
メトリック、およびエンタープライズ統合を備えられています。
Hosted GraphiteのAPIを使用して、コード内の変更、構築、自動化を行います。
メトリクスを送信するプロトコル(TCP、UDP、HTTP、StatsD)を選択します。
アプリケーションやシステムが大きく成長したときでも、監視ソリューションを
心配する必要はありません。Hosted Graphiteの使用でスケーリングが
容易に可能となります。
Metricfireは世界中の24時間年中無休でサポートを提供するため、監視ソリューション
は常に稼働しています。また、全てのチームにセットアップとオンボーディングの
サポートも提供しています
Hosted Graphiteは、5秒、30秒、1時間、1日の単位で、データ(obvs、min、max、sumなどを含む)の異なる統計ビュー(obvs、min、max、sumなどを含む)
を自動的に生成します。
2年間のデータを保存するには、コストがかかり、小さなチームにとっては大きな
重荷となります。Hosted Gaphiteを使用して、最大2年間の長期保管で長期的な
傾向について洞察を得れるようになります。
エンタープライズのDevOpsチームにとって専用環境は非常に重要です。
Hosted Graphiteでは、お客様の要件に合ったカスタム環境を構築できます。

ベンダーによるロックインはありません。
データのエクスポートも自在で、
制限がありません。

アドオンなしの透明な価格設定と
なっており、
カスタムメトリクスも
追加コストがありません。

高いカーディナリティデータとタグ付き
メトリックを 処理する効率的な
データベースです。

余分なコストなしで、1秒あたりで大規模な データセットとデータポイントを
処理できます。

独自の統合を接続するか、 独自の統合を構築することができます。

2012年以来、何千人ものエンジニアが MetricFireに信頼を置いています。
エンジニアの貴重な時間を
利用して、監視ソリューションを実行するのではなく、御社の製品の開発・構築ができる環境を作り上げましょう。
インフラストラクチャーに
関わるサーバーを管理すること
は、それだけも一苦労です。
弊社のインフラストラクチャー
は、御社と共に成長とできる
ように構築されています。
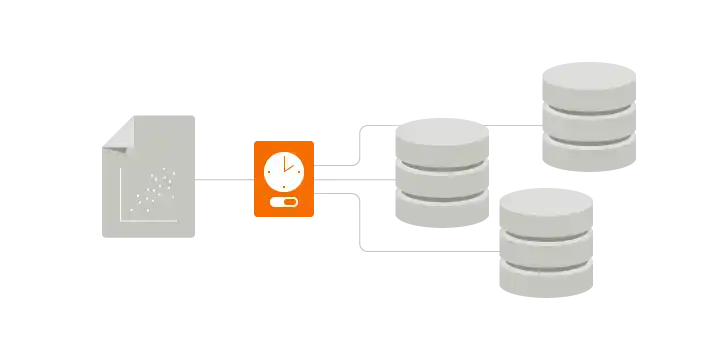
長期的なメトリックストレージは時間とコストがかかります。Hosted Graphiteでは、3倍の冗長ストレージで2年間データを保存します。
セルフホスティングの場合、
サポートは自分で行います。
Hosted Graphiteなら弊社の
エンジニアがセットアップ、
トラブルシューティングを
お手伝いします。

Because our system is your system.
MetricFire runs Graphite and Grafana as a fully managed service for small engineering teams, taking care of storage, scaling, and version updates so your team doesn't have to. Plans start at $19/month, billed per metric namespace rather than per host, and include engineer-staffed support. Integrations work natively with Heroku, AWS, Azure, and GCP, and data is stored with 3× redundancy in SOC2- and ISO:27001-certified data centres.
We host Graphite so you don’t have to! We handle and manage your metric collection, storage, alerting, and visualization services so you can focus on more important things.
Hosted Graphite provides ways for you to send data from your applications, servers, and infrastructure to plot that data on professional and easy-to-read custom dashboards.
We give you the tools you need to send large amounts of data and get accurate information back out, analyze it, alert on it, and share it. This alongside integrations with other popular services, account/team management options and offer great support.
You could self-host your monitoring and spend a few hours setting it up, send some test data, and feel good when the graphs start working. That’s the fun part. The less fun part comes later when scaling, version updates, or performance issues pull you away from real work and turn self-monitoring into a constant distraction. So we handle all of that for you and let your team focus on what actually matters.
We define a metric as a unique time-series metric namespace that is stored with our service. Sending updated counts for existing metrics in your account will not count as a new metric we bill on. We charge on the total number of unique metrics in an account, not the amount of data points the metric receives. Also, we do not bill separately between host (CPU) metrics, custom metrics, or tagged metrics - 1 metric is 1 metric.
This is the number of individual data points that are sent to each unique metric name space, per second. If you send a VERY high rate of DPPS, rate limiting or 'throttling' will be applied to protect the health of our systems.
If you have very heavy DPPS traffic, we can help you configure a pre-aggregation service for your metrics, like StatsD or carbon-c-relay.
When you sign up for a free trial, you get a full test of Hosted Graphite for 14 days including 500 total metrics, 5 user seats, alerts, dashboards, Hosted StatsD, logging options, and access to all integrations.
If you need help setting up a custom trial account for a PoC, please contact support@metricfire.com or book a call with us and we can help set this up for you.
Yes! You can share your dashboards with teammates, customers, or whoever you need. We don’t charge extra for this.
It takes about 60s for your metric data to be available for visualisation once it has been ingested and stored in our backend.
Yes, MetricFire supports Single Sign On (SSO) via SAML-enabled identity providers. Just reach out to us and we will enable this feature in your account, for free.
We understand there needs to be flexibility here. If you are consistently going over your metric limit, the data points that you are sending will be dropped.
We are happy to work with you as your monitoring partner so we’ll send you a message to offer support with managing your metrics, or help you find the plan level that suits you best.
Also, we have a dashboard and alerts automatically created in your account to let you know if you're getting close to your metric limit and if data points are being dropped.
Yes! We manage a Heroku Add-On and you can get dyno, router, postgres, redis, kafka, and process metrics with the HG Add-On, or with a dedicated Hosted Graphite account.
We provide email and live chat support for all plans and we answer quickly! Our team is made of experienced engineers committed to great service.
We are based in the USA but we have team members based in multiple countries so we can provide support during a wide range of hours. We provide support via email, live chat and technical support meetings.
We aggregate and store data at the following resolutions:
When querying data in your Dashboards, we map the following time spans to the following resolutions:
Yes, we support graphite tagging, have our own Tag API, and have a Tag Search UI feature so you can easily locate and manage your tagged metrics. Refer to our Graphite Tag doc for more details.
Yes! Our composite graphite alerting lets you combine multiple alert conditions (using AND / OR logic), so alerts trigger only when the full rule is satisfied.
Data is stored in ISO:27001 and SOC2 Certified Data centres located in Frankfurt, Germany. Metrics sent to us directly are stored on bare-metal database servers, provided by Hetzner. Learn more here.

We operate a distributed eventually-consistent database built upon open-source Riak. In case of failure, the workload is distributed and we store three redundant copies of all data at all aggregation resolutions. Queries will get back to the user with answers only when two different systems agree, which is also useful for fault tolerance. We also have backup, failover, and disaster recovery plans in place you never have to worry about data loss.