Aproveite o poder do Hosted Graphite para obter insights em tempo real sobre seus aplicativos Heroku e bancos de dados Postgres.

Mantenha uma vigilância constante sobre o seu ambiente Heroku com acesso instantâneo a métricas detalhadas. Detecte anomalias, acompanhe tendências e garanta que seus aplicativos e bancos de dados estejam funcionando sem problemas.

Painéis automatizados diretamente do fluxo de logs do Heroku para seus Dynos. Aumente-os com métricas personalizadas para rastrear seus aplicativos e personalizar e visualizar seus dados sem esforço. Crie facilmente gráficos, tabelas e relatórios adaptados às suas necessidades exclusivas de monitorização.

À medida que os seus aplicativos Heroku crescem, o Hosted Graphite é dimensionado com você. Desde pequenos projectos a implementações em grande escala, a nossa plataforma adapta-se às suas exigências de monitorização.

Integre-se perfeitamente à sua configuração do Heroku. Conecte sem esforço seus aplicativos e bancos de dados ao Hosted Graphite e comece a monitorar sem qualquer aborrecimento. O Hosted Graphite nunca comprometerá a velocidade do seu aplicativo. Envie o quanto quiser sem se preocupar em diminuir a velocidade de seus usuários.

Because our system is your system.
MetricFire runs Graphite and Grafana as a fully managed service for small engineering teams, taking care of storage, scaling, and version updates so your team doesn't have to. Plans start at $19/month, billed per metric namespace rather than per host, and include engineer-staffed support. Integrations work natively with Heroku, AWS, Azure, and GCP, and data is stored with 3× redundancy in SOC2- and ISO:27001-certified data centres.
We host Graphite so you don’t have to! We handle and manage your metric collection, storage, alerting, and visualization services so you can focus on more important things.
Hosted Graphite provides ways for you to send data from your applications, servers, and infrastructure to plot that data on professional and easy-to-read custom dashboards.
We give you the tools you need to send large amounts of data and get accurate information back out, analyze it, alert on it, and share it. This alongside integrations with other popular services, account/team management options and offer great support.
You could self-host your monitoring and spend a few hours setting it up, send some test data, and feel good when the graphs start working. That’s the fun part. The less fun part comes later when scaling, version updates, or performance issues pull you away from real work and turn self-monitoring into a constant distraction. So we handle all of that for you and let your team focus on what actually matters.
We define a metric as a unique time-series metric namespace that is stored with our service. Sending updated counts for existing metrics in your account will not count as a new metric we bill on. We charge on the total number of unique metrics in an account, not the amount of data points the metric receives. Also, we do not bill separately between host (CPU) metrics, custom metrics, or tagged metrics - 1 metric is 1 metric.
This is the number of individual data points that are sent to each unique metric name space, per second. If you send a VERY high rate of DPPS, rate limiting or 'throttling' will be applied to protect the health of our systems.
If you have very heavy DPPS traffic, we can help you configure a pre-aggregation service for your metrics, like StatsD or carbon-c-relay.
When you sign up for a free trial, you get a full test of Hosted Graphite for 14 days including 500 total metrics, 5 user seats, alerts, dashboards, Hosted StatsD, logging options, and access to all integrations.
If you need help setting up a custom trial account for a PoC, please contact support@metricfire.com or book a call with us and we can help set this up for you.
Yes! You can share your dashboards with teammates, customers, or whoever you need. We don’t charge extra for this.
It takes about 60s for your metric data to be available for visualisation once it has been ingested and stored in our backend.
Yes, MetricFire supports Single Sign On (SSO) via SAML-enabled identity providers. Just reach out to us and we will enable this feature in your account, for free.
We understand there needs to be flexibility here. If you are consistently going over your metric limit, the data points that you are sending will be dropped.
We are happy to work with you as your monitoring partner so we’ll send you a message to offer support with managing your metrics, or help you find the plan level that suits you best.
Also, we have a dashboard and alerts automatically created in your account to let you know if you're getting close to your metric limit and if data points are being dropped.
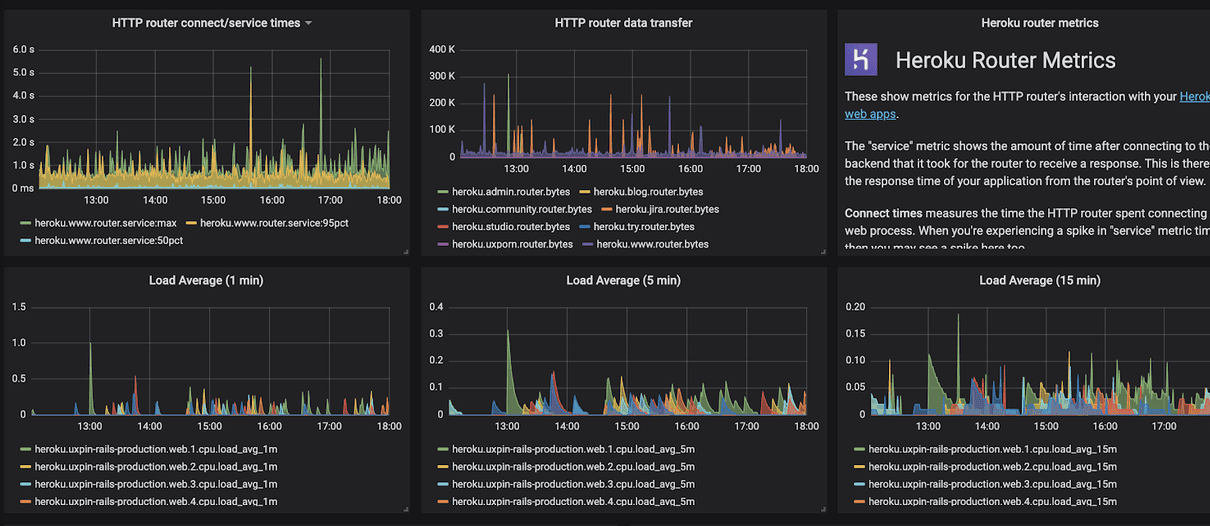
Yes! We manage a Heroku Add-On and you can get dyno, router, postgres, redis, kafka, and process metrics with the HG Add-On, or with a dedicated Hosted Graphite account.
We provide email and live chat support for all plans and we answer quickly! Our team is made of experienced engineers committed to great service.
We are based in the USA but we have team members based in multiple countries so we can provide support during a wide range of hours. We provide support via email, live chat and technical support meetings.
We aggregate and store data at the following resolutions:
When querying data in your Dashboards, we map the following time spans to the following resolutions:
Yes, we support graphite tagging, have our own Tag API, and have a Tag Search UI feature so you can easily locate and manage your tagged metrics. Refer to our Graphite Tag doc for more details.
Yes! Our composite graphite alerting lets you combine multiple alert conditions (using AND / OR logic), so alerts trigger only when the full rule is satisfied.
Data is stored in ISO:27001 and SOC2 Certified Data centres located in Frankfurt, Germany. Metrics sent to us directly are stored on bare-metal database servers, provided by Hetzner. Learn more here.

We operate a distributed eventually-consistent database built upon open-source Riak. In case of failure, the workload is distributed and we store three redundant copies of all data at all aggregation resolutions. Queries will get back to the user with answers only when two different systems agree, which is also useful for fault tolerance. We also have backup, failover, and disaster recovery plans in place you never have to worry about data loss.