Com o Hosted Graphite, você não está preso à ferramenta da sua plataforma.
O Hosted Graphite foi construído desde o início para lidar com sistemas exigentes que requerem altos pontos de dados por segundo.
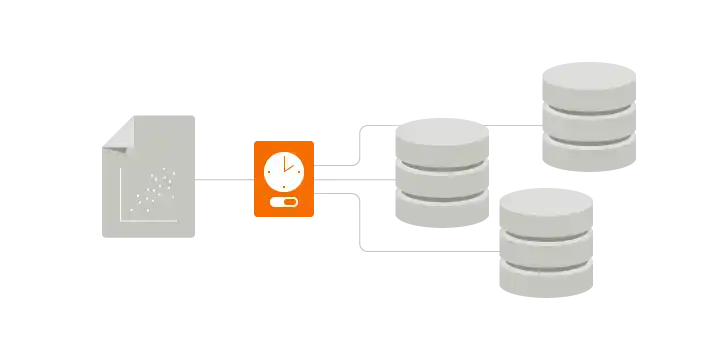
Com o Hosted Graphite, você economiza tempo e dinheiro de desenvolvimento porque nós controlamos os servidores com armazenamento 3x redundante e backups de hora em hora para que você nunca perca suas métricas.
O Graphite é uma solução de monitoramento de código aberto comprovada pela indústria. No entanto, o MetricFire é um Graphite personalizado com um agente incorporado, métricas marcadas e integrações empresariais.
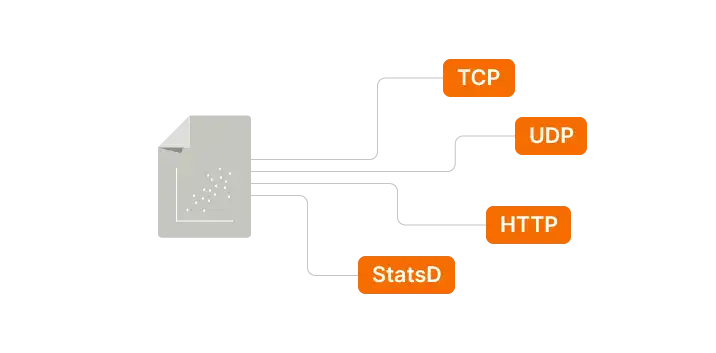
Use as APIs do Hosted Graphite para modificar, criar e automatizar dentro do seu código. Escolha seu protocolo (TCP, UDP, HTTP, StatsD) sobre como deseja enviar métricas.
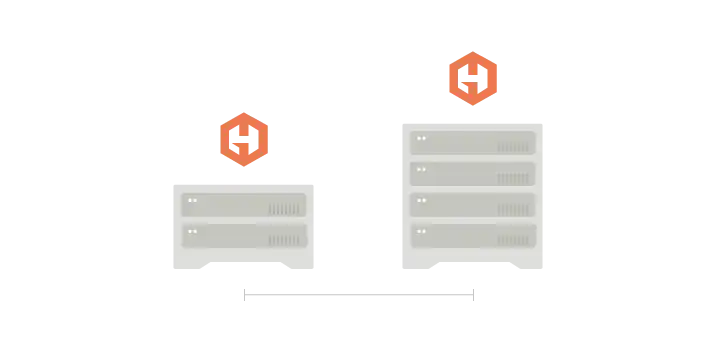
Não deveria ter de se preocupar com soluções de monitorização quando as suas aplicações ou sistemas crescem. Com o Hosted Graphite, nós escalamos quando você escala.
O MetricFire fornece suporte mundial 24 horas por dia, 7 dias por semana, 365 dias por ano, para que esteja sempre a funcionar. Também oferecemos apoio na configuração e integração para que a sua equipa tenha o controle do monitoramento.
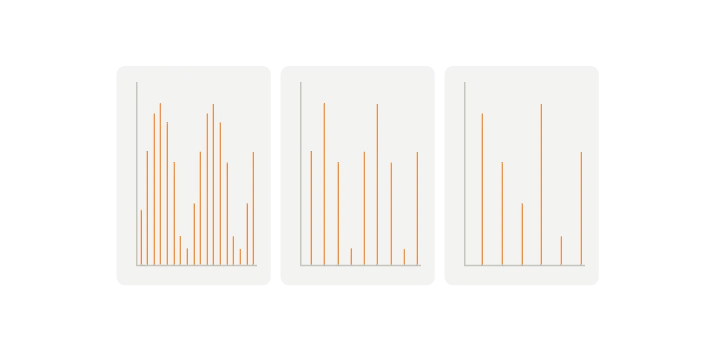
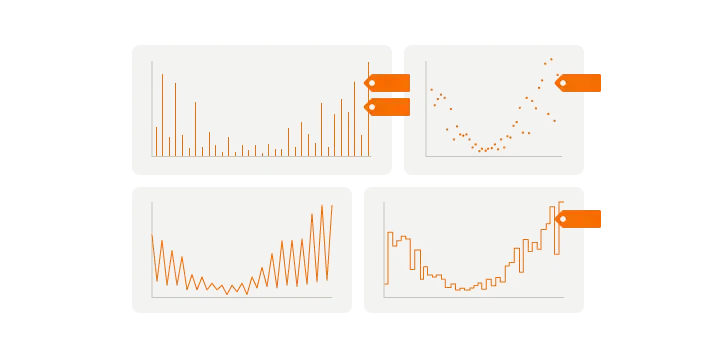
O Hosted Graphite produz automaticamente diferentes visualizações estatísticas dos seus dados (por exemplo: obvs, min, max, sum) com resoluções de 5 segundos, 30 segundos, 1 hora e 1 dia.
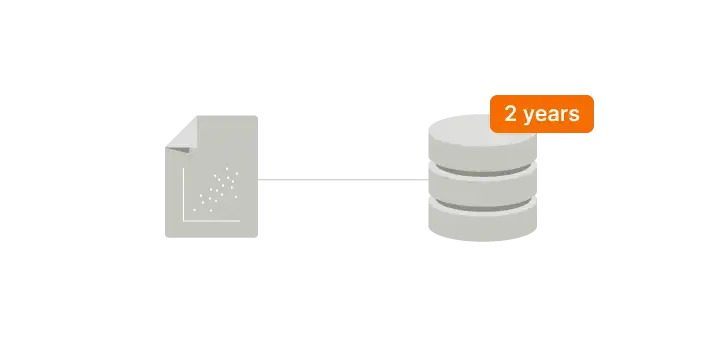
O armazenamento de 2 anos de dados pode ser dispendioso. Com o Hosted Graphite, obtenha informações sobre tendências de longo prazo com até 2 anos de armazenamento.
Um ambiente dedicado é fundamental para as equipas DevOps empresariais. Com o Hosted Graphite, podemos criar um ambiente personalizado que atenda às suas necessidades.
Com o Hosted Graphite, você economiza tempo e dinheiro de desenvolvimento porque nós controlamos os servidores com armazenamento 3x redundante e backups de hora em hora para que você nunca perca suas métricas.
O Graphite é uma solução de monitoramento de código aberto comprovada pela indústria. No entanto, o MetricFire é um Graphite personalizado com um agente incorporado, métricas marcadas e integrações empresariais.
Use as APIs do Hosted Graphite para modificar, criar e automatizar dentro do seu código. Escolha seu protocolo (TCP, UDP, HTTP, StatsD) sobre como deseja enviar métricas.
Não deveria ter de se preocupar com soluções de monitorização quando as suas aplicações ou sistemas crescem. Com o Hosted Graphite, nós escalamos quando você escala.
O MetricFire fornece suporte mundial 24 horas por dia, 7 dias por semana, 365 dias por ano, para que esteja sempre a funcionar. Também oferecemos apoio na configuração e integração para que a sua equipa tenha o controle do monitoramento.
O Hosted Graphite produz automaticamente diferentes visualizações estatísticas dos seus dados (por exemplo: obvs, min, max, sum) com resoluções de 5 segundos, 30 segundos, 1 hora e 1 dia.
O armazenamento de 2 anos de dados pode ser dispendioso. Com o Hosted Graphite, obtenha informações sobre tendências de longo prazo com até 2 anos de armazenamento.
Um ambiente dedicado é fundamental para as equipas DevOps empresariais. Com o Hosted Graphite, podemos criar um ambiente personalizado que atenda às suas necessidades.

Sem dependência de fornecedores. Exporte os seus dados porque os seus dados devem estar acessíveis.

Preços transparentes sem suplementos e métricas personalizadas sem custos adicionais.

Base de dados eficiente para tratar dados de elevada cardinalidade e métricas etiquetadas.

Capaz de tratar grandes conjuntos de dados e pontos de dados por segundo sem os custos adicionais.

Ligue as suas próprias integrações ou crie as suas próprias integrações.

Desde 2012, milhares de engenheiros confiam no MetricFire.
Aproveite ao máximo o valioso tempo dos seus engenheiros para se concentrarem na construção do seu produto, em vez de ficarem atolados na execução da sua solução de monitorização.
Gerir os servidores necessários para obter informações significativas sobre a sua infraestrutura pode ser uma tarefa árdua. A nossa infraestrutura foi concebida para se adaptar às suas necessidades.
O armazenamento métrico a longo prazo pode ser moroso e dispendioso. Com o Hosted Graphite, armazenamos seus dados por 2 anos com 3 vezes mais armazenamento redundante.
No caso da auto-hospedagem, o suporte é seu. Os nossos engenheiros especializados podem ajudar a configurar o seu sistema de monitorização, solucionar problemas e resolver rapidamente quaisquer problemas.
Neste vídeo, aprenderá a monitorizar o seu caso de utilização através da criação de gráficos com dados de séries temporais (nome da métrica, valor e carimbo de data/hora).

Because our system is your system.
MetricFire is the fully managed Graphite and Grafana platform for small teams that don’t want to self-host their monitoring stack. Pre-built dashboards, alerts, and native add-ons for Heroku, AWS, Azure, and GCP. All with dedicated support and no infrastructure to maintain.
We host Graphite so you don’t have to! We handle and manage your metric collection, storage, alerting, and visualization services so you can focus on more important things.
Hosted Graphite provides ways for you to send data from your applications, servers, and infrastructure to plot that data on professional and easy-to-read custom dashboards.
We give you the tools you need to send large amounts of data and get accurate information back out, analyze it, alert on it, and share it. This alongside integrations with other popular services, account/team management options and offer great support.
You could self-host your monitoring and spend a few hours setting it up, send some test data, and feel good when the graphs start working. That’s the fun part. The less fun part comes later when scaling, version updates, or performance issues pull you away from real work and turn self-monitoring into a constant distraction. So we handle all of that for you and let your team focus on what actually matters.
We define a metric as a unique time-series metric namespace that is stored with our service. Sending updated counts for existing metrics in your account will not count as a new metric we bill on. We charge on the total number of unique metrics in an account, not the amount of data points the metric receives. Also, we do not bill separately between host (CPU) metrics, custom metrics, or tagged metrics - 1 metric is 1 metric.
This is the number of individual data points that are sent to each unique metric name space, per second. If you send a VERY high rate of DPPS, rate limiting or 'throttling' will be applied to protect the health of our systems.
If you have very heavy DPPS traffic, we can help you configure a pre-aggregation service for your metrics, like StatsD or carbon-c-relay.
When you sign up for a free trial, you get a full test of Hosted Graphite for 14 days including 500 total metrics, 5 user seats, alerts, dashboards, Hosted StatsD, logging options, and access to all integrations.
If you need help setting up a custom trial account for a PoC, please contact support@metricfire.com or book a call with us and we can help set this up for you.
Yes! You can share your dashboards with teammates, customers, or whoever you need. We don’t charge extra for this.
It takes about 60s for your metric data to be available for visualisation once it has been ingested and stored in our backend.
Yes, MetricFire supports Single Sign On (SSO) via SAML-enabled identity providers. Just reach out to us and we will enable this feature in your account, for free.
We understand there needs to be flexibility here. If you are consistently going over your metric limit, the data points that you are sending will be dropped.
We are happy to work with you as your monitoring partner so we’ll send you a message to offer support with managing your metrics, or help you find the plan level that suits you best.
Also, we have a dashboard and alerts automatically created in your account to let you know if you're getting close to your metric limit and if data points are being dropped.
Yes! We manage a Heroku Add-On and you can get dyno, router, postgres, redis, kafka, and process metrics with the HG Add-On, or with a dedicated Hosted Graphite account.
We provide email and live chat support for all plans and we answer quickly! Our team is made of experienced engineers committed to great service.
We are based in the USA but we have team members based in multiple countries so we can provide support during a wide range of hours. We provide support via email, live chat and technical support meetings.
We aggregate and store data at the following resolutions:
When querying data in your Dashboards, we map the following time spans to the following resolutions:
Yes, we support graphite tagging, have our own Tag API, and have a Tag Search UI feature so you can easily locate and manage your tagged metrics. Refer to our Graphite Tag doc for more details.
Yes! Our composite graphite alerting lets you combine multiple alert conditions (using AND / OR logic), so alerts trigger only when the full rule is satisfied.
Data is stored in ISO:27001 and SOC2 Certified Data centres located in Frankfurt, Germany. Metrics sent to us directly are stored on bare-metal database servers, provided by Hetzner. Learn more here.

We operate a distributed eventually-consistent database built upon open-source Riak. In case of failure, the workload is distributed and we store three redundant copies of all data at all aggregation resolutions. Queries will get back to the user with answers only when two different systems agree, which is also useful for fault tolerance. We also have backup, failover, and disaster recovery plans in place you never have to worry about data loss.