
Table of Contents
Great systems are not just built. They are monitored.
MetricFire runs Graphite and Grafana as a fully managed service for growing engineering teams, taking care of storage, scaling, and version updates so your team doesn't have to. Plans start at $19/month, billed per metric namespace rather than per host, and include engineer-staffed support. Integrations work natively with Heroku, AWS, Azure, and GCP, and data is stored with 3× redundancy in SOC2- and ISO:27001-certified data centres.
Introduction
Throughout this series, we explored several concepts that build toward a more service-oriented approach to alerting in Graphite. We covered metric naming conventions, wildcard grouping strategies, and composite alert logic using AND / OR conditions. Each article focused on a different part of the problem, but the overall goal remained the same: reducing alert noise while improving operational clarity.
This final article puts those concepts into practice because internally, we were facing some similar alerting challenges described throughout this series. We wanted to apply these ideas to our own infrastructure and reduce the amount of noisy, redundant alerts generated during incidents.
At MetricFire, one of the internal infrastructure layers responsible for handling ingestion traffic is a routing layer we refer to as the cops layer. These servers sit in the middle of the ingestion pipeline and are responsible for forwarding, replaying, and routing metric traffic between different parts of the system. Like most production infrastructure, the cops layer exposes multiple metrics and internal services. When something goes wrong, several alerts can fire simultaneously, even when they all describe the same root issue.
This article walks through how we restructured multiple internal alerts into a single service-level alert using composite logic. The result was fewer alerts, clearer incidents, and a much more useful signal during on-call response.
1: The Problem with Metric-Level Infrastructure Alerts
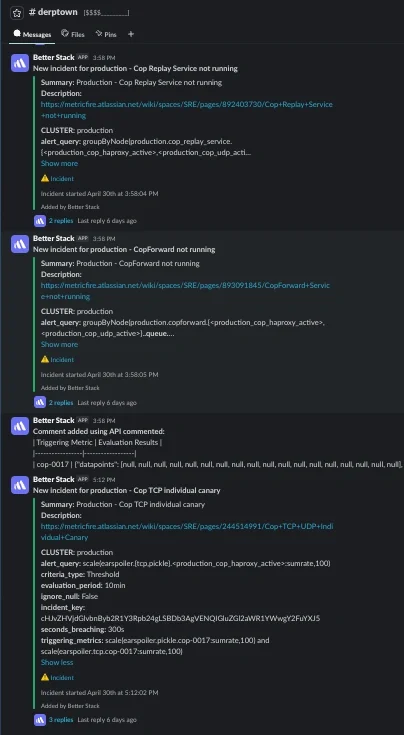
The original problem was fairly simple: if a cop server went offline, it triggered several independent alerts at the same time. Each alert represented a different metric or internal component, but operationally they all described the same failure condition. For example, a single host outage could trigger alerts for:
- forwarder queue processing
- replay queue processing
- dropped TCP/UDP canary datapoints
Each alert was technically correct, but they were all describing the same underlying problem and created unnecessary noise in Slack and PagerDuty. The real issue was not that the metrics were inaccurate, but that the alerts were still tied to individual signals instead of representing the health of the service as a whole.
Multiple Alerts, One Root Cause
At MetricFire, the cops layer is made up of several internal components that each handle a different part of the traffic routing pipeline.
One of the primary services is called copforward, which handles forwarding metrics toward aggregation destinations. Another is the replay service, which processes spillover metrics when downstream destinations become unavailable.
Internally, the replay service tracks spool files written by cop services when forwarding fails. Those spool files are processed asynchronously and replayed later once destinations become available again. Because the replay service itself is heavily based on copforward, some of the operational metrics overlap and can be monitored in similar ways.
This meant that if a cop host went fully offline, many metric signals changed. Canary metrics stopped reporting, forwarding and replay queue metrics disappeared because those services were no longer running, and dropped datapoints increased as traffic could no longer move cleanly through the routing layer. Each alert accurately reflected the state of its respective signal, but operationally they were all describing the same underlying issue of the host simply being offline.
2: Reframing the Problem as a Service
The turning point came when we stopped thinking about the problem in terms of individual metrics and started thinking about it in terms of service behavior. Instead of asking:
"Which metrics should alert?"
We started asking:
"Which signals best describe the health of the cops service?"
That distinction changed how we approached alerting entirely. The cops layer itself became the service boundary, while the underlying metrics became signals describing different aspects of that service. For this particular alert update, we decided that the important signals were:
- host uptime
- forwarding queue activity
- replay queue activity
- dropped datapoints
Each one represented a different operational failure mode within the same system and this aligned more closely with the service and signal model described throughout the previous articles. The goal was no longer to alert on metrics independently, but to define a single alert that represented the state of the cops service as a whole.
The Composite Alert Definition
Using our own Composite Alerting, we configured a single service-level alert using four conditions:
IF production.diamond.cop-*.uptime.minutes is missing FOR 10min

OR groupByNode(production.copforward.cop-*.*.queue.*, 2) is missing FOR 10min

OR groupByNode(production.cop_replay_service.cop-*.*.queue.*, 2) is missing FOR 10min

OR production.cop-*.cop-*.datapoints.dropped_destination_full:sum is above 2500 EVER
In the alert description, we simply listed what each condition represents:
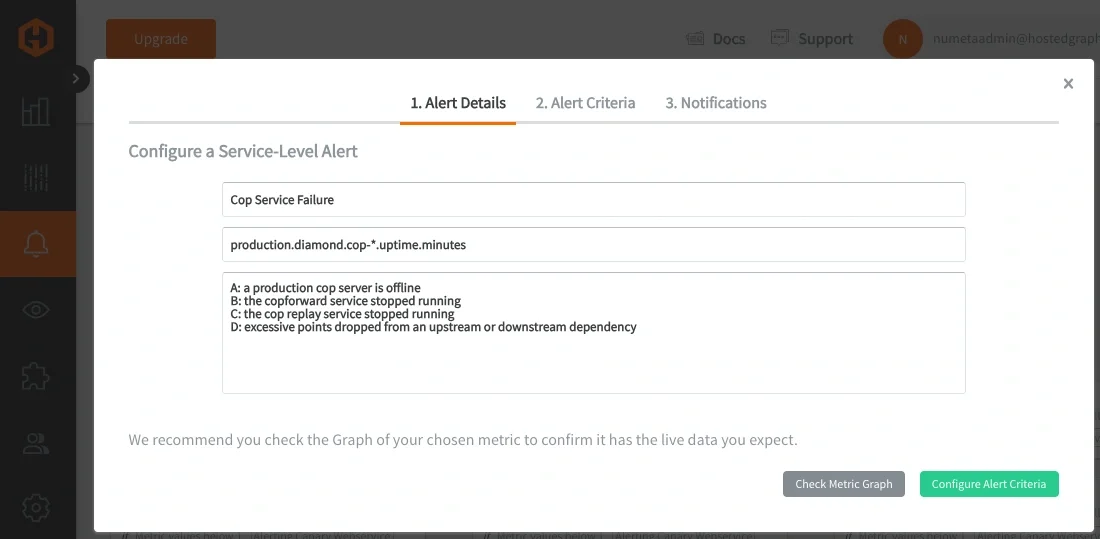
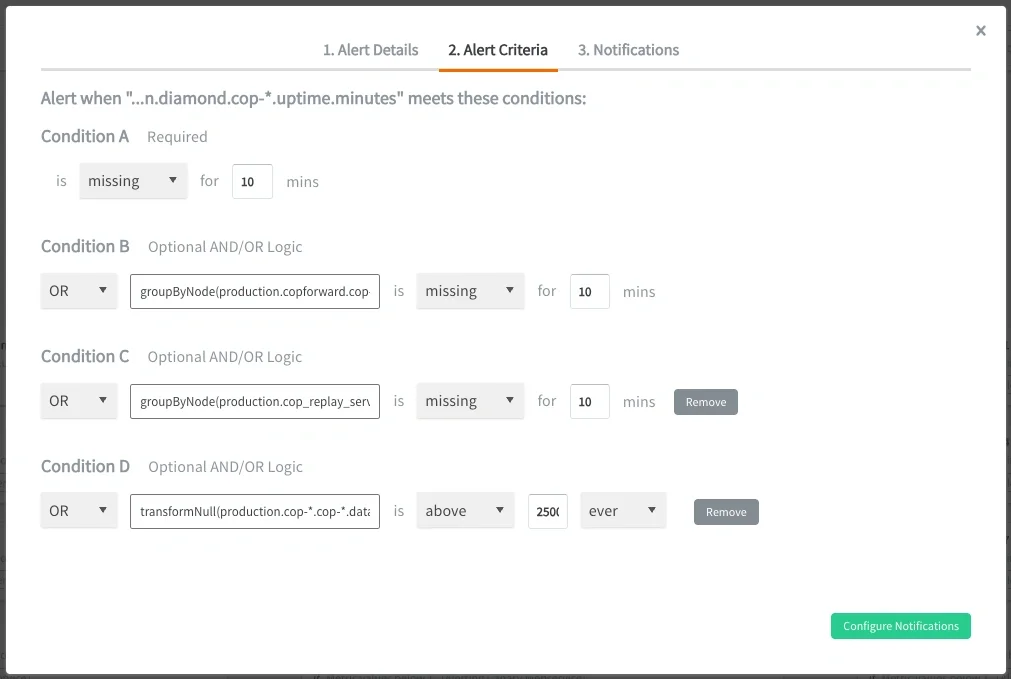
Each condition described a different signal within the same service. So instead of generating separate alerts for each component, the alert now represented the overall health of the traffic routing layer itself. NOTE: these alert queries use wildcard grouping to target the entire fleet of cop servers, while Graphite functions such as groupByNode() are used to further aggregate the grouped metrics.
3: From Multiple Alerts to One Service-Level Alert
Once the composite alert was in place, the operational behavior changed immediately. Previously, a cop outage generated several independent alerts that required engineers to manually determine whether they were related. After restructuring the alert around the service boundary, the same failure produced a single alert containing the relevant offending metrics. This dramatically reduced noise during incidents and made the alerts easier to interpret under pressure. So instead of seeing:
- a forwarding alert
- a replay alert
- a dropped canary datapoints alert
The on-call engineer now sees:
- one cop service alert
- a list of the triggered signals
This is where the concepts from the previous articles fully come together because now the alert represents the service and the offending metrics explain why:

Why Offending Metrics Matter
Returning the offending metrics list (or Triggered metrics) ended up being just as important as the composite logic itself. Previously, wildcard alert queries returned the grouped wildcard expression itself instead of the specific metrics responsible for triggering the alert. This created additional investigation overhead during incidents because engineers still needed to manually determine which host or signal within the service had degraded. With offending metrics enabled, the alert only returns the signals that actually breached their conditions.
This creates a much tighter feedback loop during incident response because engineers immediately know:
- which host is affected
- which signal triggered
- which part of the service degraded
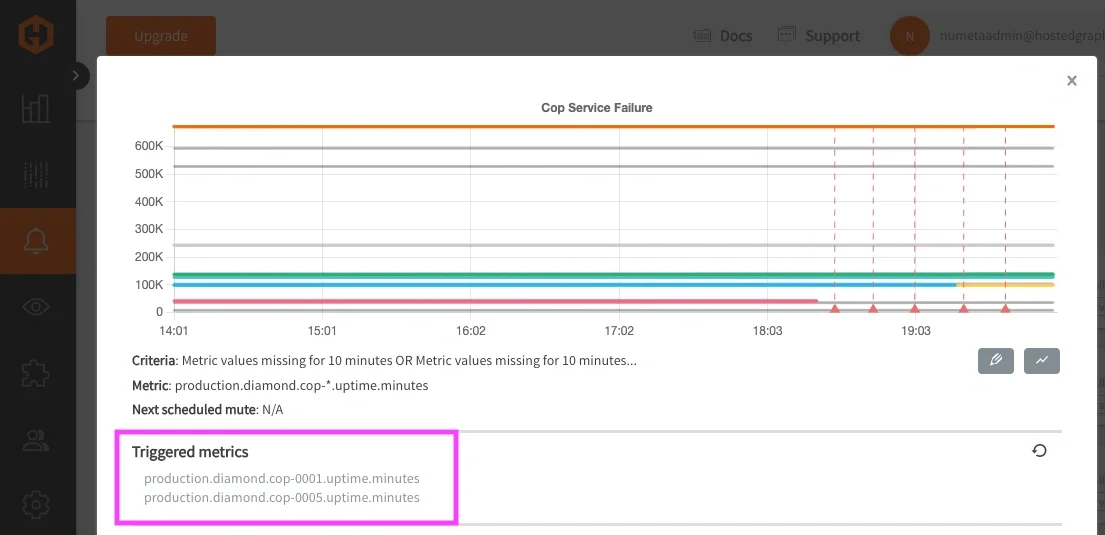
That reduced the amount of manual correlation required during on-call response and made our cop alerts substantially more actionable.
4: Operational Impact
This change did not eliminate alerts from the system, nor was that the goal. The goal was to make alerts represent meaningful operational conditions instead of isolated metric changes. By restructuring alerts around services and their signals, we reduced duplicate notifications and made incidents easier to understand during active response. Engineers no longer needed to mentally group several independent alerts together to understand that a single infrastructure issue was occurring. This also improved how we reason about alerts internally because instead of defining alert rules around individual metrics, we now think about alerting in terms of:
- what service is affected
- which signals describe that service
- which combinations of signals indicate meaningful degradation
That shift made the alerting system easier to scale operationally as infrastructure grows more complex. While every environment is different, the same principles apply broadly across SRE and DevOps teams. Systems rarely fail because of a single isolated metric. More often, multiple related signals begin to change together, and alerting systems become much more useful when they reflect that reality. When multiple metrics must be connected to understand a system's health, you might also consider data integration solutions like Integrate.io, which helps teams connect and transform data across databases, APIs, and CRMs to power operational workflows and analytics.
Conclusion
This alerting series started with a simple problem: noisy alerts. Along the way, we explored how metric structure affects grouping, how wildcard queries can define service boundaries, and how composite logic allows alerts to represent meaningful system behavior instead of isolated threshold crossings.
This final example brought those ideas together in a real production environment. By treating the MetricFire cops layer as a service and their metrics as signals, we were able to replace several redundant alerts with a single service-level alert that provided clearer operational context and more actionable incident response. The result was a shift toward alerts that better reflect how systems actually behave in practice.
If you missed the earlier articles in this series, they provide important context for the concepts explored in this case study:
- Reducing Alert Noise: Metric Naming Best Practices in Graphite
- Reducing Alert Noise: Service-Level Alerting with Graphite Wildcards
- Reducing Alert Noise: Composite Alerting and Conditional Logic in Graphite
Together, these concepts form a practical framework for building more scalable and maintainable alerting systems in Graphite. Start a FREE trial with MetricFire today and reach out to us to learn about how you can effectively reduce alerting noise in your Graphite monitoring stack!

