


Table of Contents
Great systems are not just built. They are monitored.
MetricFire runs Graphite and Grafana as a fully managed service for growing engineering teams, taking care of storage, scaling, and version updates so your team doesn't have to. Plans start at $19/month, billed per metric namespace rather than per host, and include engineer-staffed support. Integrations work natively with Heroku, AWS, Azure, and GCP, and data is stored with 3× redundancy in SOC2- and ISO:27001-certified data centres.
Introduction
In the previous article, we defined service-level alerts using wildcard queries to group related signals. That approach reduces alert noise by ensuring alerts represent systems instead of individual metrics.
However, even well-grouped alerts can still be overly sensitive. A single signal crossing a threshold does not always indicate a real issue. Systems are complex, and individual signals often fluctuate under normal conditions, and this is where composite alerting becomes useful. Instead of evaluating signals independently, composite alerts allow you to define conditions that reflect how a service behaves as a whole.
In this article, we build on the service and signal model by introducing conditional logic. Using AND and OR relationships, alerts can be defined in a way that captures meaningful system behavior instead of isolated anomalies.
1: Why Single-Condition Alerts Fall Short
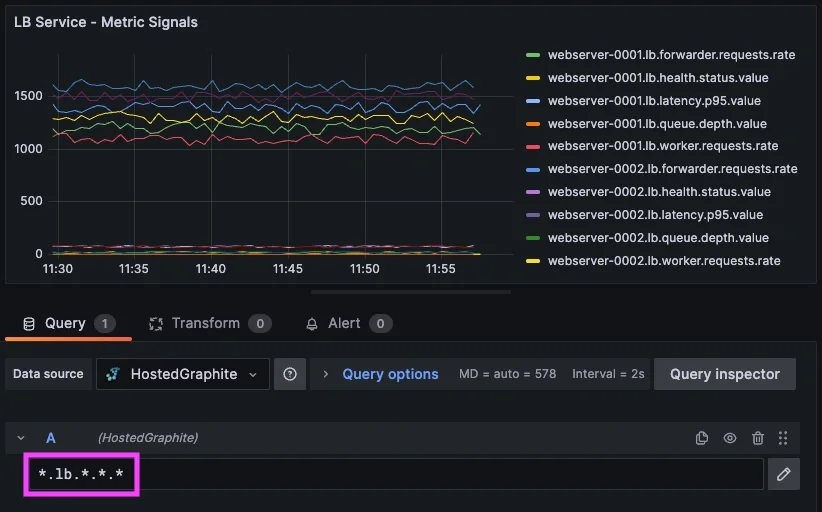
Even when alerts are grouped correctly, single-condition thresholds can still produce noise. Consider the load balancing service metrics we've used as an example:
<host>.lb.forwarder.requests.rate
<host>.lb.worker.requests.rate
<host>.lb.queue.depth.value
<host>.lb.latency.p95.value
<host>.lb.health.status.value
Each of these metric signals provides useful information, but they do not always indicate service failure on their own. For example:
- latency may spike briefly during traffic bursts
- queue depth may increase during normal load fluctuations
- request rate can dip temporarily due to uneven traffic distribution
If alerts are triggered on any one of these conditions independently, they may fire even when the system is operating normally and this can lead to a different kind of alert noise. Instead of duplicate alerts, you get alerts that are technically correct but less actionable. So in essence, the problem is not with the metric groupings - the problem is context.
2: Using Composite Alerting
Composite alerting allows you to define alerts based on multiple conditions instead of a single threshold.
Rather than asking:
“Did one metric cross a threshold?”
You can ask:
“Is the system behaving in a way that indicates a real issue?”
This is done using logical conditions such as AND and OR (&& ||). For example, a composite alert for the load balancing service could be defined as:
IF <host>.lb.forwarder.requests.rate < X AND <host>.lb.queue.depth.value > X
OR <host>.lb.latency.p95.value > X
OR <host>.lb.health.status.value < 1
THEN trigger an LB-service alert
This defines multiple ways the service can fail, all within a single alert. Each condition represents a signal, and together they define how the service behaves under failure.
Understanding OR vs AND Logic
The choice between OR and AND is important.
Using OR logic means: Trigger the alert if any one of these conditions is met.
This is useful for detecting different types of failure within a service. For example, a service might fail due to latency, availability, or throughput issues, and each should trigger an alert independently.
Using AND logic means: Trigger the alert only when multiple conditions are true at the same time.
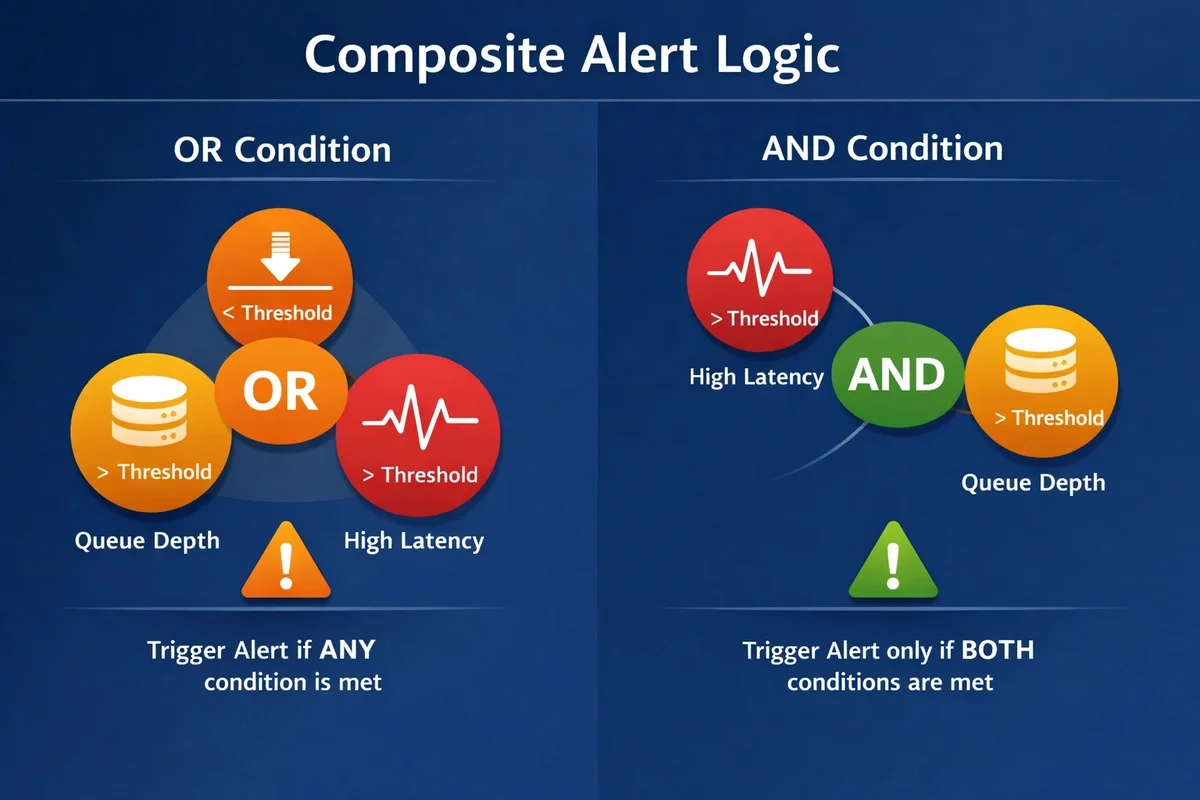
This ensures that latency spikes only trigger an alert when they are accompanied by increasing queue depth, which is more likely to represent a real issue. In practice, most composite alerts use a combination of both AND / OR logic to help reduce false positives.
3: Defining Service Behavior with Signals
This is where the service and signal model becomes most useful because each service exposes multiple signals that describe different aspects of its behavior. Some signals represent throughput or traffic flow, while others describe latency, saturation, availability, or overall system health.
Composite alerts allow these signals to be evaluated together using conditional logic. Instead of reacting to isolated metric changes, alerts can now represent meaningful service behavior and capture multiple failure scenarios within a single alert definition. For our load balancing example, a realistic composite alert might look like:
IF (*.lb.latency.p95.value > 120 AND *.lb.queue.depth.value > 75)
OR (*.lb.health.status.value < 1)
OR (*.lb.forwarder.requests.rate < 1000)

THEN send an LB-service alert.
This approach allows a single alert to represent the state of the load balancing service, while the underlying signals explain why the alert triggered.
Applying This Across Services
This pattern extends naturally to other services (api, jobs, db, etc).
For the API layer:
IF (*.api.latency.p95.value > X AND *.api.errors.total.rate > X)
OR (*.api.workers.active.value > X)
THEN send an API-service alert
For the DB layer:
IF (*.db.latency.p95.value > X AND *.db.connections.active.value > X)
OR (*.db.writes.total.rate < X)
THEN send a DB-service alert
Each service defines its own behavior based on its signals, but the structure remains the same. This consistency makes it easier to scale alerting across systems without increasing complexity.
Returning Offending Signals in Composite Alerts
Composite alerts still benefit from returning only offending metrics from a grouped wildcard (*) set. When a composite alert triggers, it will only return the signals that satisfied the condition.
For the LB-service example, if the following conditions are met: latency > threshold AND queue depth > threshold
The offending metric signals list might include:
- webserver-0002.lb.latency.p95.value = 320
- webserver-0002.lb.queue.depth.value = 85
If a different condition triggers: worker requests < threshold AND forwarded requests < threshold
The list of offenders might include:
- webserver-0001.lb.worker.requests.rate = 825
- webserver-0001.lb.forwarder.requests.rate = 780
An alert can also be used to monitor service health across the entire system, rather than defining separate alerts per service. For example, with a grouped wildcard query like: *.*.health.status.value
This alerting query evaluates health signals across ALL services & hosts, will trigger whenever any service reports an unhealthy state FOR X minutes, and returns the affected metric signals:
- webserver-0003.lb.health.status.value = 0
- db-0001.db.health.status.value = 0
This model keeps alerting aligned with how systems are actually understood and operated. By allowing alerts to represent the state of a service while signals provide the underlying context, it separates detection from diagnosis without losing clarity. The result is a more intuitive and scalable approach, where alerts communicate impact and signals reveal cause.
Combining Service Signals with Host Agent Metrics
So far, the examples in this article have focused on custom service-level signals such as latency, throughput, and health. While these describe how a service behaves, they do not always explain why that behavior is changing because service degradation is often influenced by underlying system conditions. Metrics collected by agents like Telegraf, e.g: telegraf.<host>.mem.used_percent can be combined with service-level signals to add important context.
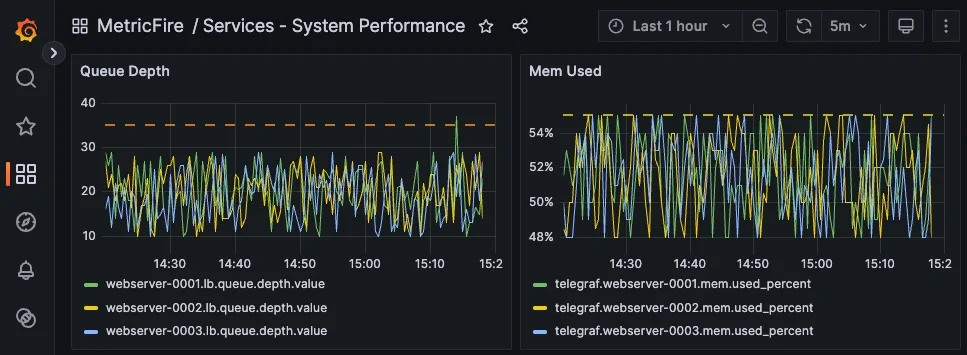
Composite alerts can include all types of metrics. For example, an alert could trigger when Queue Depth is high and memory usage on the host is elevated. This helps distinguish between application issues and resource constraints, making alerts more informative and easier to act on.
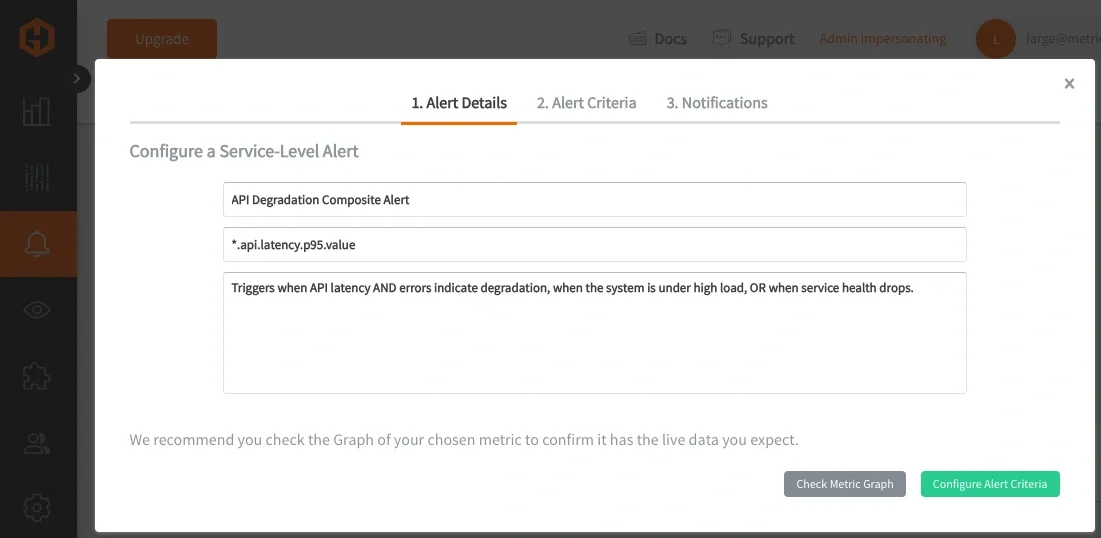
4: Applying These Concepts in MetricFire’s Hosted Graphite
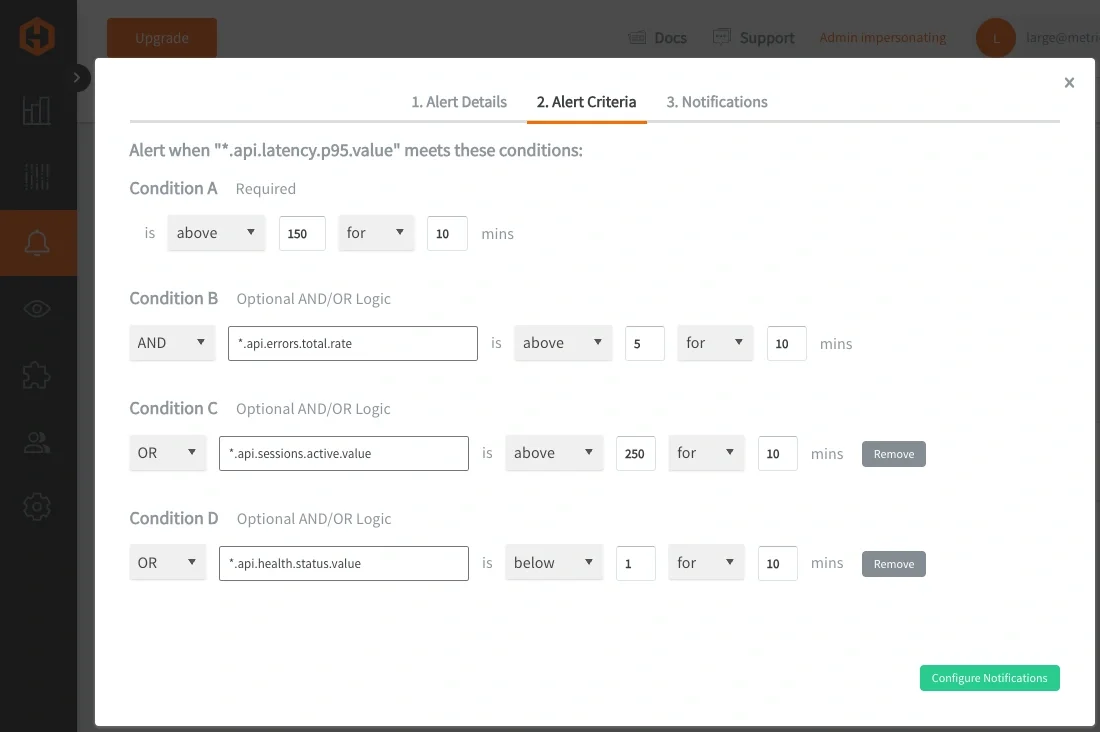
In Hosted Graphite, Composite Alerts can be defined directly within the Alerts UI, making it easier to build and manage complex alert logic without relying on multiple separate rules.
Each alert can be composed of one or more metric queries, conditions can be applied to those queries, and logical relationships will define how those conditions are evaluated together. Wildcard queries (*) are still used to define the scope of a service alert, while composite logic determines how the underlying signals are interpreted.
Composite Alerting is currently supported through the Hosted Graphite Alerts API, a user interface for composite alerts is being built and is COMING SOON:
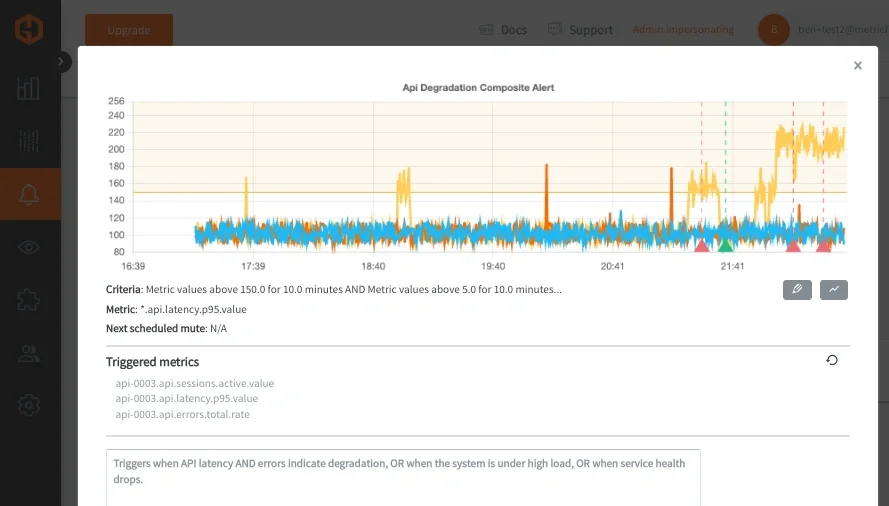
This approach reduces the number of alert rules required by consolidating related conditions into a single, cohesive definition. It also improves signal quality by ensuring alerts are only triggered when meaningful patterns emerge, rather than reacting to transient or isolated changes. Over time, this leads to a more stable and maintainable alerting system that better represents how services actually operate under load.
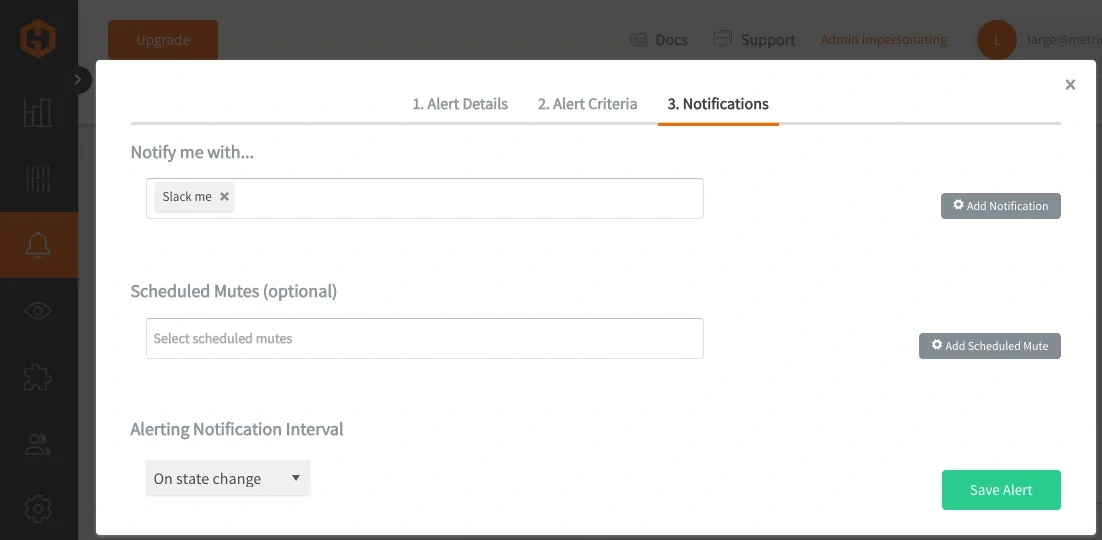
Once triggered, alerts can be routed through standard notification channels such as Email, Slack, PagerDuty, MSTeams, webhooks, and will list all offending metrics from a grouped wildcard query.
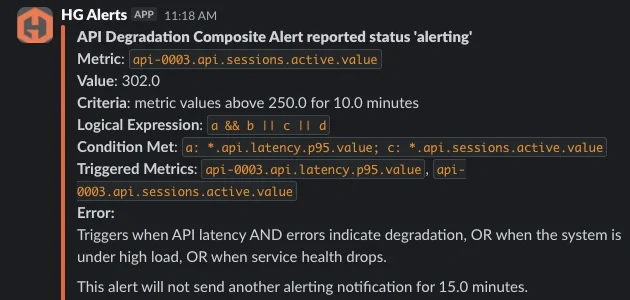
The updated notification format makes composite alerts much easier to interpret during incidents because each triggered metric can now be traced back to the condition that evaluated true. Instead of only seeing a grouped wildcard query, engineers can immediately identify which part of the alert logic was satisfied and which underlying signals contributed to the alert.
For example, if condition A represents high API latency and condition C represents elevated active sessions, the notification will show both the logical conditions that were met and the offending metrics associated with those conditions. This provides much clearer operational context during triage and reduces the amount of manual investigation required to understand why an alert fired.
At MetricFire, we ran into this exact issue within our own alerting infrastructure, specifically in a routing layer responsible for handling incoming traffic. Multiple components within that layer could fail at the same time and each one generated its own alert, resulting in a cluster of alerts that all pointed to the same underlying issue.
After restructuring our alerts to follow a more consistent service and signal hierarchy, we were able to group those components under a single "service-level" alert. That made it possible to evaluate the health of the service as a whole and then identify which specific signals were responsible when something went wrong. Learn how we applied these same concepts within MetricFire’s internal alerting infrastructure to reduce noisy, redundant alerts across our production traffic routing layer.
When working in Hosted Graphite, this structure translates directly into how you build dashboards and alerts. Queries become simpler because they rely on predictable paths, and alert rules can operate across an entire service layer, rather than being tied to individual metrics.
Conclusion
Service-level alerting reduces noise by grouping related signals into a single view of a system. Composite alerting builds on that foundation by defining how those signals interact, allowing alerts to reflect meaningful system behavior instead of isolated metric changes.
As systems grow in complexity, this shift becomes essential. Instead of reacting to individual thresholds, alerts begin to represent real service conditions, making them easier to trust and faster to act on. This reduces false positives, improves signal clarity, and shortens the time between detection and diagnosis.
Taken together, metric structure, wildcard grouping, and composite logic form a complete Graphite alerting model. One that scales with your system, aligns with how engineers think about internal services, and ultimately turns metric data into actionable insight.


