
Table of Contents
Introduction
Internet-of-Things (IoT) devices and technologies have penetrated into our life. Nowadays, we can easily find IoT devices around us. Home appliance manufacturers produce IoT products for smart homes. Car makers invest in smart vehicles that can communicate with other smart cars and IoT objects nearby. Governments allocate huge resources to build smart cities with IoT technologies to improve the quality of life for people and promote economic growth. Researching and building these devices and infrastructures, without a doubt, are important tasks for our future. What’s equally important is ensuring those IoT infrastructures work smoothly. The key to success here is monitoring.
In this article, we will share the best Grafana dashboards for IoT devices and discuss the metrics from MQTT and Graphite. Before we begin, check MetricFire. MetricFire offers comprehensive monitoring solutions with Hosted Grafana and Hosted Graphite. You can gain in-depth insight into your IoT resources with minimal configuration.
If you would like to learn more about it, please book a demo with us, or sign on to the free trial today.
Key Takeaways
This article discusses the importance of monitoring IoT devices, provides an overview of MQTT and Graphite, and identifies MQTT metrics that should be monitored. Here are the 5 key takeaways from the article:
-
MQTT is an OASIS standard messaging protocol for IoT that works as a lightweight messaging publisher and subscriber suitable for connecting remote devices with minimal network bandwidth.
-
MQTT has various use cases in different sectors, including smart homes, logistics, and transportation. For example, smart meters can be connected to a local network to monitor and control individual home appliances, and Deutsche Bahn AG uses MQTT to enable communication between trains and wayside monitoring systems.
-
Monitoring MQTT is essential because when MQTT fails, IoT devices and machines cannot exchange messages, which can lead to a broad infrastructure failure. Some MQTT metrics that should be monitored include percentage of connected devices, message load, and active users.
-
Graphite is an open-source monitoring software designed to perform reliably on affordable hardware or cloud infrastructure. People use Graphite to track the performance of their resources such as websites, applications, network servers, and more.
-
MetricFire offers comprehensive monitoring solutions with Hosted Grafana and Hosted Graphite that provide in-depth insight into IoT resources with minimal configuration.
What is MQTT in IoT
To create informative monitoring metrics and choose the right dashboard, we need to understand our target system. MQTT is an OASIS standard messaging protocol for the Internet of Things (IoT). The protocol works as a lightweight messaging publisher and subscriber that is suitable for connecting remote devices with a small code footprint and minimal network bandwidth. MQTT is used in various fields including automotive, manufacturing, telecommunications, mining, and more. MQTT also allows bilateral messaging between device and the cloud. With this capability, IoT devices can broadcast messages to groups of things. The messaging protocol can scale to communicate with millions of IoT devices.
MQTT use cases
IoT technologies have been adopted in various areas, and where there are IoT technologies, there is MQTT. To better understand IoT and MQTT, we will share some use cases of those technologies in different sectors.
Smart home
You can find smart home IoT devices easily these days. Go to a home appliance store and look around. You can see all kinds of smart devices from desk lamps to a fridge. Among many, smart meters can help you to save your utility bills and achieve energy efficiency as a whole. Smart meters can collect more details about energy consumption than the existing meters. They can be connected to a local network to monitor and control individual home appliances by their owner. An MQTT client can be embedded in the smart meter to send messages to the network.
Logistics
In logistics, the use of autonomous drones to deliver goods has been on the rise. This new way of transporting items provides great benefits by reducing travelling time. For instance, there has been an attempt to use those drones to transport medical samples between hospitals and testing labs. Traditionally, this task was done by medical couriers, which were often delayed due to traffic congestion. During flights, drones and landing platforms transmit MQTT messages in real time so that its telemetry information can be used to track flight status closely.
Transportation
Deutsche Bahn AG is one of the largest logistics companies in the world. For decades, the company relied on machine-to-machine (M2M) solutions for machine communication. For machine connectivity, they used Short-Message-Service (SMS), which was expensive to run and maintain. In an effort to modernize their infrastructure and to run their railway system more efficiently and economically, they decided to apply IoT technologies and remove M2M. With MQTT, they enabled communication between trains and wayside monitoring systems.
MQTT metrics
We learned the concept of IoT technology and the role of MQTT. We were able to discover the benefits and the level of innovation they can bring to our everyday life and industries. However, one important aspect we haven’t covered yet is monitoring. Since we now understand the role of MQTT, we also know that when MQTT fails, IoT devices and machines cannot exchange messages, which can lead to a broad infrastructure failure. To prevent this, having an optimal monitoring system is essential. In this section, we will discuss what MQTT metrics we want to monitor.
Percentage of connected devices
The most basic but fundamental metric you want to measure is how many IoT devices are normally connected out of all. Devices send a heartbeat (or ping) to the connected networks. As you monitor MQTT, you may find some devices become offline. By using these metrics, you can diagnose the overall health of your IoT devices.
Message load
When things operate normally, IoT devices send an adequate amount of messages to an MQTT client that it can handle. However, what you don’t want to miss is a spike or an increase in your message load. A sudden increase in your message load might imply suspicious activities from one of the IoT devices connected. Or, as you increase the number of devices, the message amount will go up naturally. Either way, you will want to know when is the best time to take action for further investigation or increase message processing capabilities.
Active users
Monitoring is not only for checking faulty devices. Building the right infrastructure for IoT products and services requires a good amount of investment. If you find that there are not many active users or you witness a drop in active users, this can imply you are losing your customers and your products don’t provide enough stickiness.
What is Graphite?
Graphite is an open-source monitoring software that is designed to perform reliably on affordable hardware or cloud infrastructure. People use Graphite to track the performance of their resources such as websites, applications, network servers, and more. It is known to provide a scalable solution for real-time graphing. You can write an application that digests numeric time-series data and sends it to Graphite’s processing backend - carbon which stores the data in its database. Then, you can visualize the data on Graphite’s web interfaces.
What is Grafana?
Grafana is also an open-source analytics and interactive visualization web application. You can customize charts, graphs, and alerts. On top of its visualization features, you can design its back end. With its extensive features, you can create customized dashboards and run queries to generate the metrics you want.
Benefits of Grafana and Graphite for MQTT monitoring
Measuring IoT metrics needs certain features. One important element you want to have is time-series processing. IoT devices send messages to MQTT over time. Since Grafana and Graphite both are optimal solutions for visualizing and processing time-series data, you can confidently track their ongoing activities using this software. As we learned above, they are open-source and flexible when it comes to querying your monitoring data and designing your dashboard.
5 Best Grafana Dashboards for MQTT
Graphite is a great data source to be visualized by Grafana. Thus, the best dashboards for MQTT will be the ones that receive metrics data from Graphite.
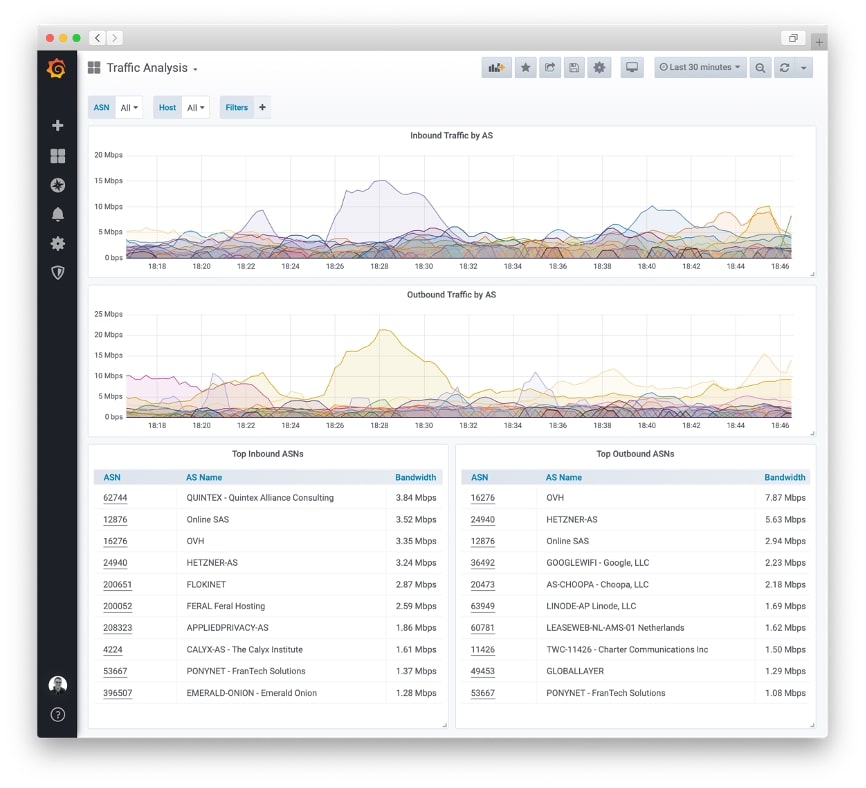
Network Traffic Flow Analysis Dashboard
This dashboard is designed specifically to monitor a series of traffic exchanges.
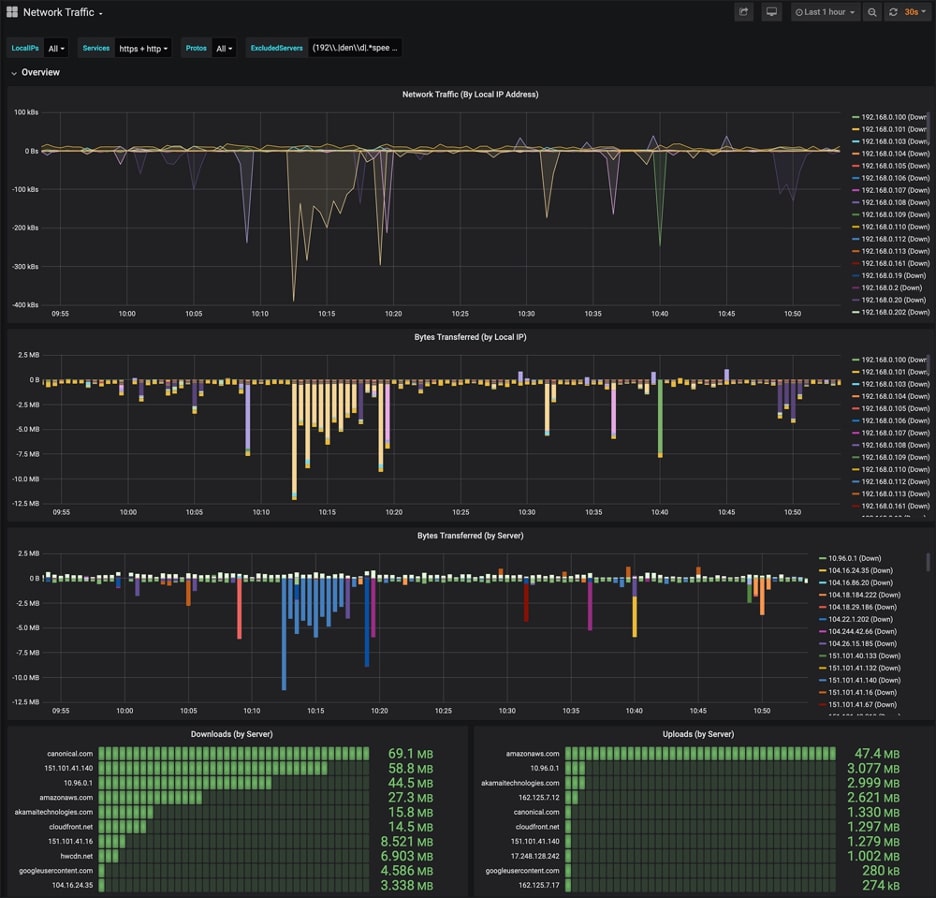
Network Monitoring Dashboard
This dashboard was designed specifically for network monitoring.
- Metrics Covered: Network Traffic, Bytes Transferred (Both by Local IP and Server)
- JSON file link: https://grafana.com/grafana/dashboards/12619
- Dependencies: Grafana (v. 6.6.2), Bar Gauge, Graph, Prometheus (1.0.0)
- Dashboard ID: 12619
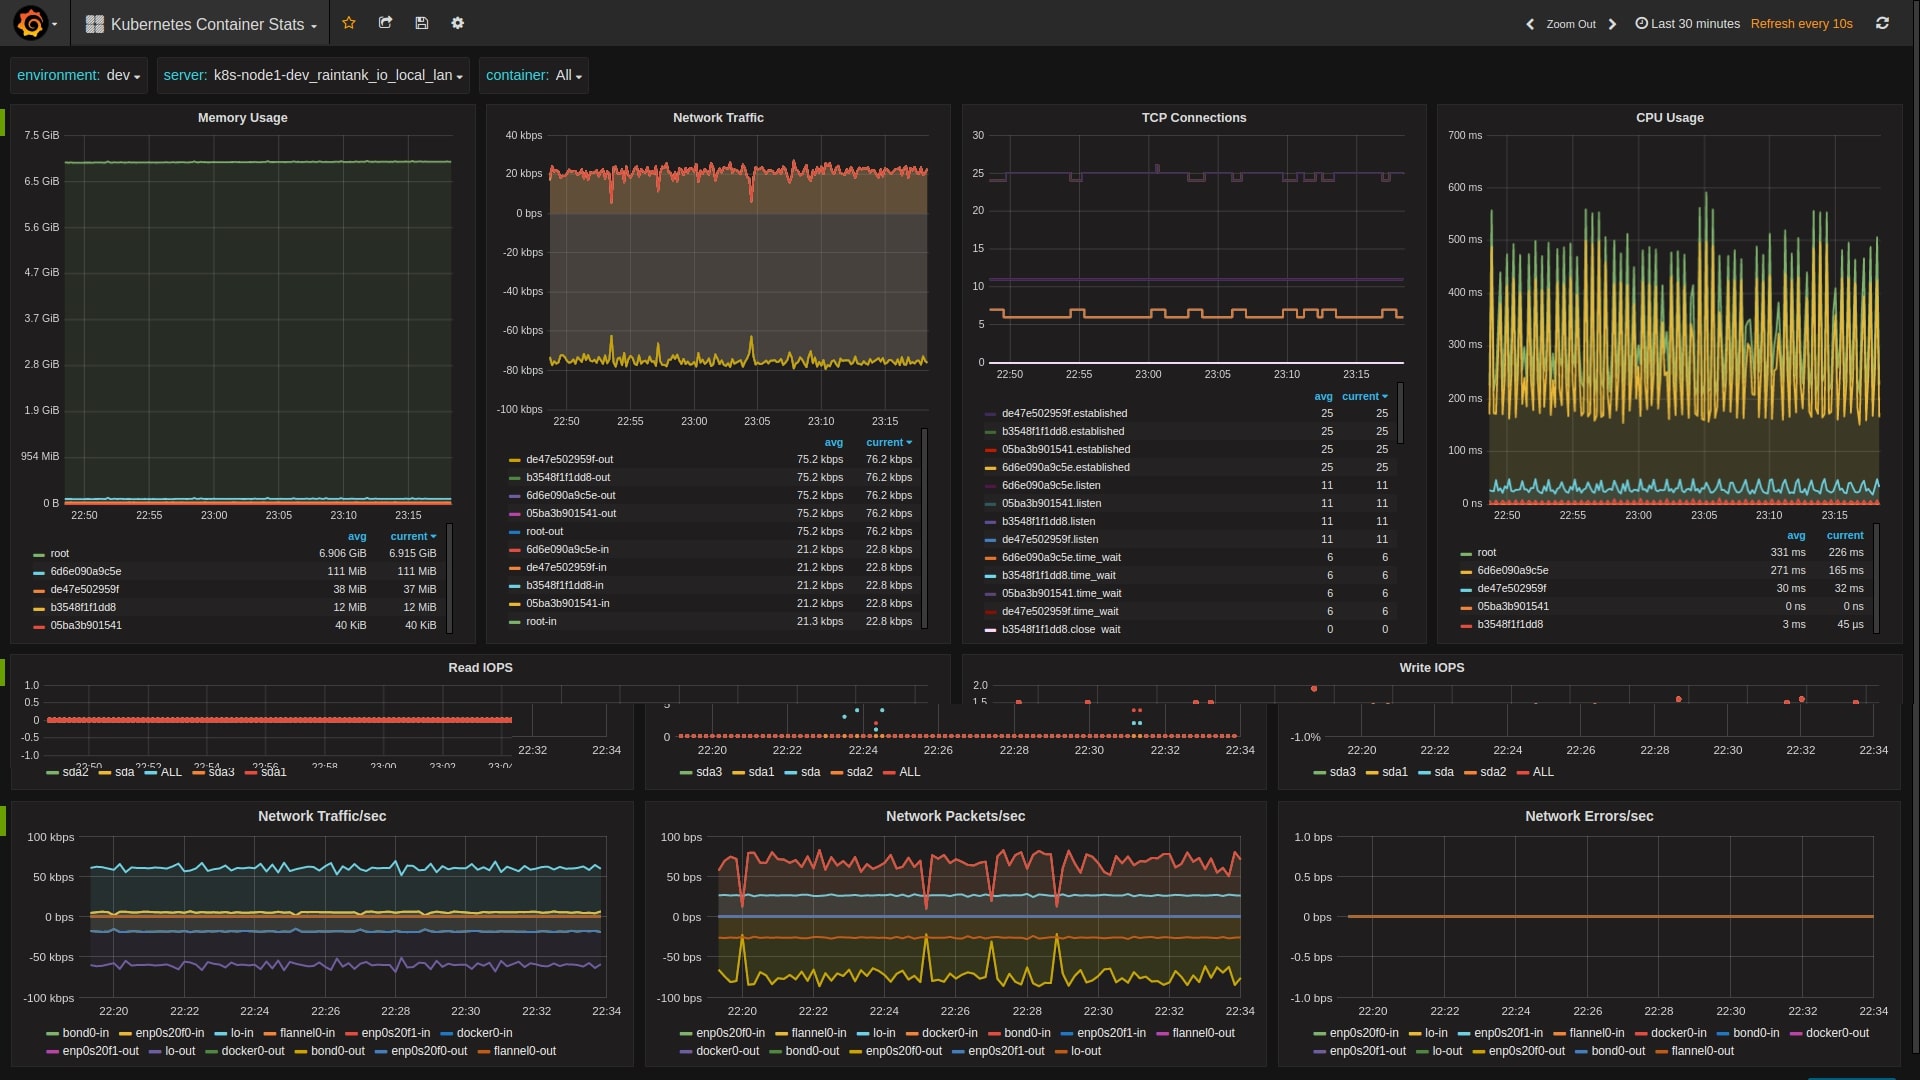
Kubernetes Container Stats
Although the name refers to the Kubernetes dashboard, we can be inspired by the design. It was designed to monitor the performance and availability metrics of Kubernetes nodes. There should be common use cases with MQTT.
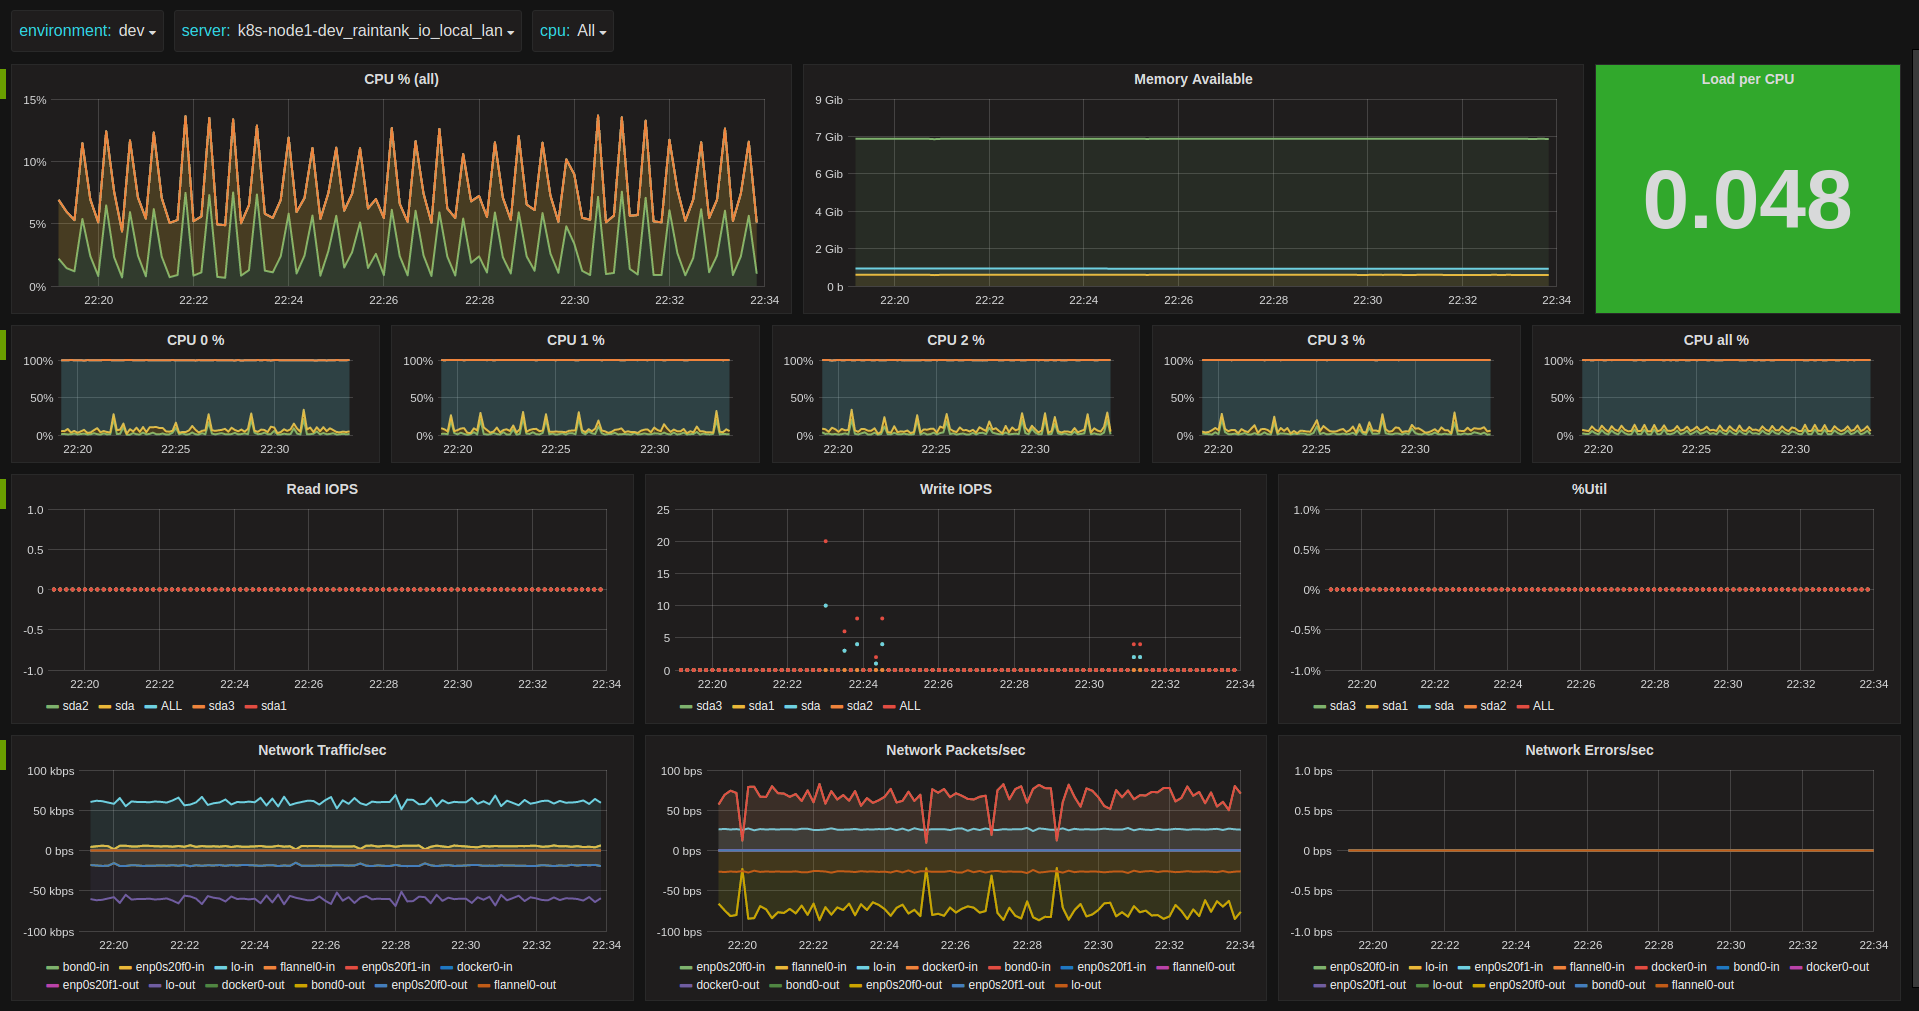
Kubernetes Node host metrics
This dashboard was designed to monitor Kubernetes node hosts, but again, we can use the concept and design behind this dashboard to monitor MQTT as well.
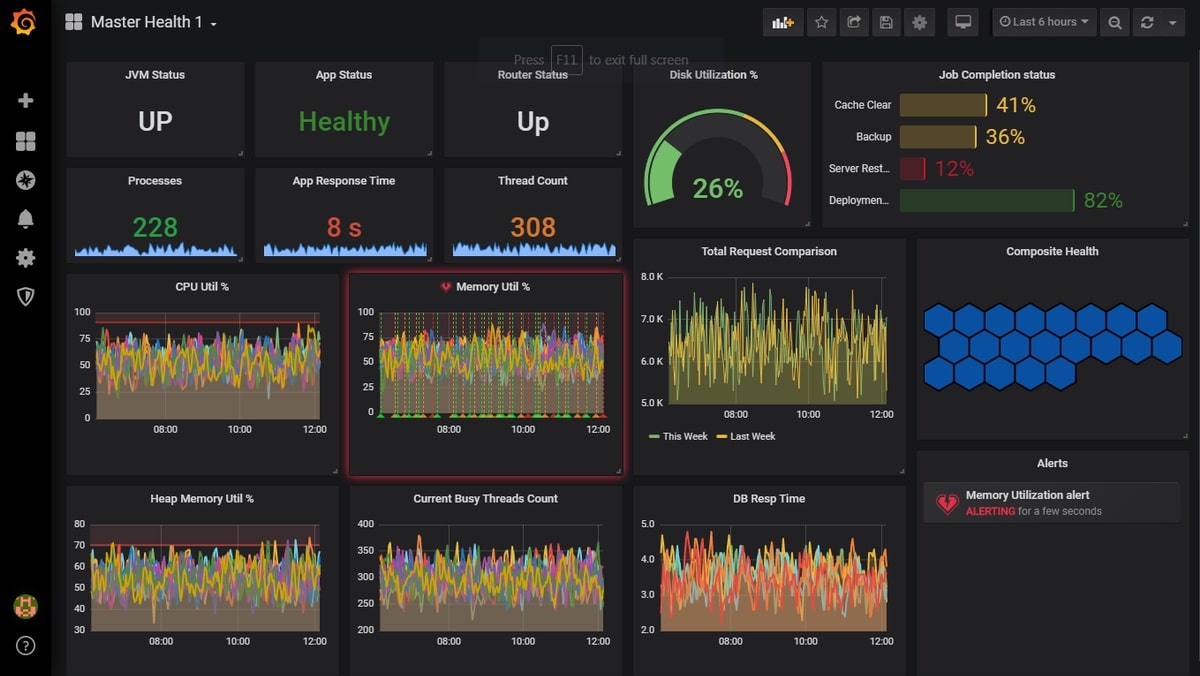
The Master Dashboard
The Master Dashboard can be versatile since it shows the overview of the most important metrics to you. It shows an extensive range of usage statuses for CPU, memory, disk, active sessions, and more.
Hosted Graphite
Grafana and Graphite both offer an extensive range of monitoring features and allow you to track the performances of your IoT resources in real-time. This real-time and time-series monitoring capability is an important factor for IoT infrastructure since you will want to know the latest metrics as fast as you can. In spite of the benefits, they can give you difficulty in maintenance due to the nature of open-source software. When you use an open source, starting from installation to implementation, all become your tasks. It will create an ongoing cost and require continuous efforts to keep them running smoothly.
If your objective is to monitor IoT resources, using hosted Graphite or Graphite will help you focus on what matters the most by reducing maintenance efforts. MetricFire provides hosting services for both monitoring software so that users can forget about the logistical burden and pay more attention to the monitoring job itself.
Wrapping up
In this article, we have learned about IoT technologies and MQTT for messaging. Both technologies have been providing enormous benefits to our everyday life and massive efficiency improvement in various industries. As they have penetrated deeply into us, when they fail, the consequences can be catastrophic. Monitoring your IoT resources is the key to preventing such an event. Grafana and Graphite provide the features you need to effectively monitor your IoT infrastructure.
Visit MetricFire today and check our Graphite as a Service and hosted Grafana.


