
Table of Contents
- 5 Common Disk Usage Issues and How To Solve Them
Great systems are not just built. They are monitored.
MetricFire hosts Graphite & Grafana as a managed service for small engineering teams, taking care of storage, scaling and version updates. Pricing starts at $19/month, billed per namespace metric instead of per host, with engineer-staffed support. Heroku, AWS, Azure, and GCP are natively integrated. We store your data with 3× redundancy in SOC2- and ISO:27001-certified data centres.
5 Common Disk Usage Issues and How To Solve Them
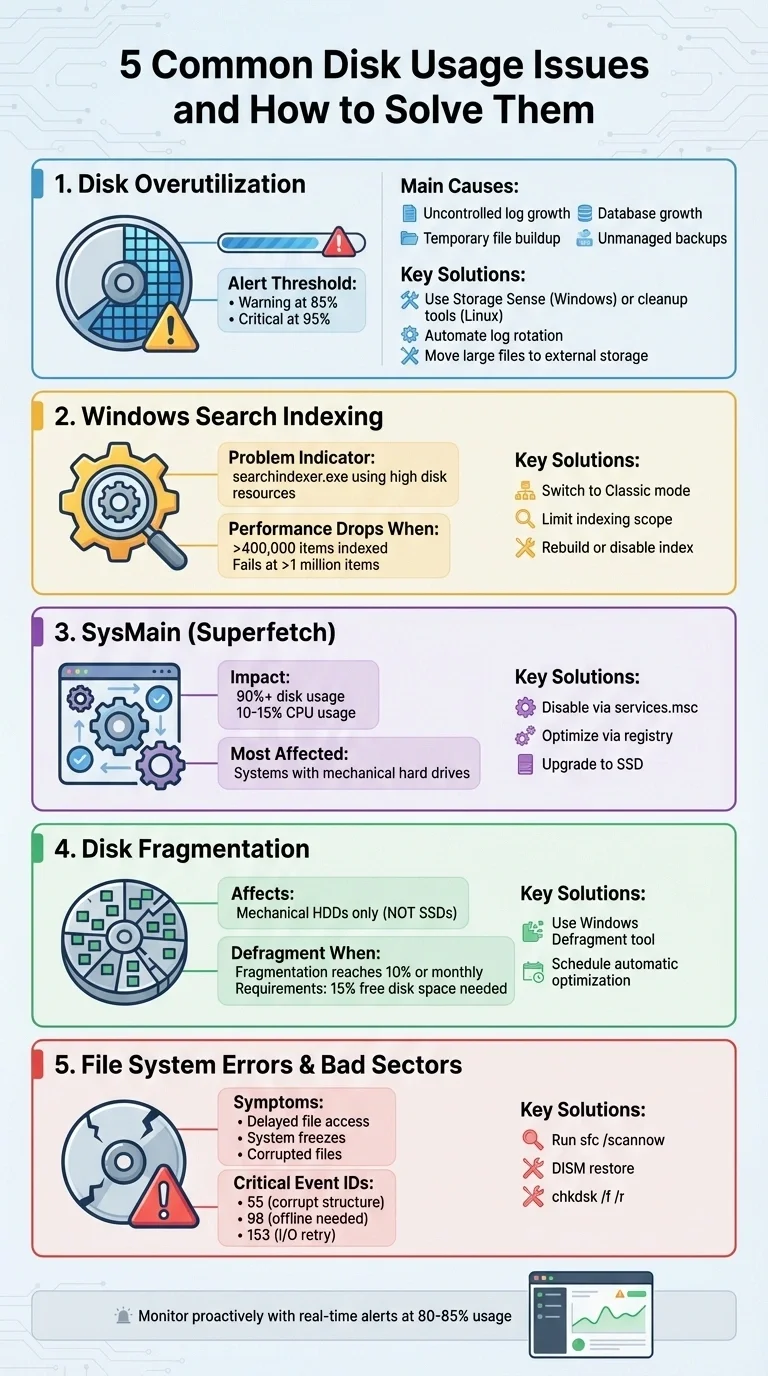
Managing disk usage is critical to maintaining system performance. High disk usage can cause slowdowns, freezes, and even crashes. Here are five common disk usage problems and their solutions:
- Disk Overutilization: Caused by logs, temporary files, database growth, and more. Solutions include cleanup tools, moving large files, and automating tasks like log rotation.
- Windows Search Indexing: Can overload the disk, especially with large file collections. Fix this by limiting indexing scope, switching to classic mode, or disabling the indexer.
- SysMain (Superfetch) Background Activity: This Windows service can cause unnecessary disk usage. Disabling it or upgrading to an SSD can help.
- Disk Fragmentation: Affects mechanical drives, slowing file access. Regular defragmentation resolves this, but SSDs don’t need it.
-
File System Errors and Bad Sectors: These cause repeated I/O retries and data loss risks. Use tools like
chkdskorsfcto repair issues.
Monitoring tools like MetricFire provide real-time alerts and dashboards to help prevent these issues. By tracking disk usage trends and setting alerts, you can act before problems escalate.
5 Common Disk Usage Issues and Solutions Overview
100% Disk Usage in Windows: 12 Things to Try
For long-term visibility, monitoring Windows performance metrics can help identify recurring disk usage spikes before they cause system slowdowns.
1. Disk Overutilization
Disk overutilization happens when your storage fills up faster than you can manage it. This can lead to serious problems: applications may stop functioning, logs may fail to record, and critical services may crash entirely.
As GridPane highlights:
Allowing your server's disk space to fill up can have serious consequences... At best, MySQL won't have enough memory to function and will go offline... At worst, you'll suffer irreversible database corruption.
When disk usage reaches 100%, services such as Windows Updates may stop working, and systems can start thrashing as physical RAM is depleted and virtual memory takes over.
What Causes Disk Overutilization
Several common issues can lead to disk overutilization:
- Uncontrolled log growth: Logs from applications and web servers can grow quickly if not rotated regularly.
-
Temporary file buildup: Directories like
/tmp,/var/tmp, and package manager caches (e.g., APT or YUM) can accumulate unnecessary files. - Database growth: Transaction and binary logs can grow rapidly, consuming significant storage.
- Unmanaged backups: Backups created locally by plugins or scripts can consume storage if not moved to external locations.
- NTFS Master File Table (MFT) expansion: On Windows, the MFT grows as files are created and doesn’t automatically shrink after deletions.
- Inode exhaustion: Even with available disk space, an excessive number of small files can exhaust inodes.
- System artifacts: Core dumps from crashed applications and leftover files from uninstalled software can linger.
-
Hibernation files: On Windows, the
hiberfil.sysfile can reserve several gigabytes for hibernation mode.
Addressing these problems is key to maintaining healthy disk performance.
How to Fix Overutilization
Here are practical steps to resolve disk overutilization:
-
Use built-in cleanup tools:
- On Windows, enable Storage Sense to automatically delete temporary files and empty the Recycle Bin when space runs low. Run Disk Cleanup and select "Clean up system files" to remove old Windows installations and update logs. Use OneDrive Files On-Demand to reduce local storage use.
-
On Linux, start with
df -hto check disk usage anddu -sh /*to identify large directories. Clear package caches withapt clean(Debian/Ubuntu) oryum clean all(CentOS/RHEL). For Docker,docker system prune -acan remove unused containers, images, and volumes. If dealing with large active log files, truncate them usingtruncate -s 0 /path/to/logfileinstead of deleting to avoid disrupting processes.
- Move large files like videos, music, and photos to external drives or cloud storage.
-
Disable hibernation on Windows if you need immediate space, using
powercfg /hibernate offto reclaim the space taken byhiberfil.sys. -
Automate cleanup tasks: Use tools like
logrotateto compress and delete old logs, schedule weekly cleanup scripts withcronto clear temporary directories and caches, and apply disk quotas to prevent individual users from consuming all available storage.
How MetricFire Helps
MetricFire's Hosted Graphite offers real-time monitoring of disk usage across your infrastructure. With a centralized dashboard, you can track usage trends and growth patterns, making it easier to spot potential problems before they escalate. Set up threshold alerts - for example, a warning at 85% capacity and a critical alert at 95% - to notify your team early. Alerts integrate with PagerDuty, Slack, email, and webhooks. Customizable Grafana dashboards let you correlate disk usage with other metrics like database size, log growth, and application activity, helping you quickly identify the root cause of unexpected spikes.
Start monitoring your infrastructure today with a free trial at Hosted Graphite or book a demo.
2. High Disk Usage from Windows Search Indexing
Windows Search Indexing is designed to speed up file searches by creating a database of your files. However, this process can sometimes push disk usage to 100%, particularly during the initial setup or when dealing with large file collections. If the indexer is processing hundreds of thousands of items, you might notice your system slowing down, with apps taking longer to open and overall performance suffering as the disk works overtime.
How to Identify Indexing Problems
To check if indexing is causing issues, open Task Manager (Ctrl + Shift + Esc) and look for searchindexer.exe in the process list. If this process is consuming excessive disk resources, indexing is likely the culprit. You can also navigate to Settings > Privacy & security > Searching Windows (on Windows 11) or Settings > Search > Searching Windows (on Windows 10) to check for status messages like "Indexing in progress" or "Index is performing maintenance."
Indexing performance tends to drop when the number of items exceeds 400,000, and it may fail entirely if the count surpasses 1 million. The index database file - Windows.db for Windows 11 or Windows.edb for Windows 10 - is stored at:
C:\ProgramData\Microsoft\Search\Data\Applications\Windows
If this file grows too large, it’s a sign that indexing is consuming excessive resources.
| Status Message | Meaning |
|---|---|
| Indexing in progress | The indexer is actively adding new files, leading to higher disk usage. |
| Indexing speed is reduced | The indexer is throttled due to user activity. |
| Index is performing maintenance | The system is optimizing the database, causing high disk I/O for up to 30 minutes. |
| Indexing complete | The indexer is idle, so disk usage from this service should be minimal. |
How to Fix Indexing Problems
If indexing is slowing down your system, you can try these solutions:
-
Switch to Classic Mode:
Go to Settings > Privacy & security > Searching Windows and choose Classic mode instead of Enhanced. Classic mode limits indexing to standard libraries like Documents and Pictures, which can significantly reduce resource usage. -
Limit the Indexing Scope:
Open Indexing Options in the Control Panel, click Modify, and exclude directories that don’t need to be indexed - like program data folders, archives, or sync folders. You can also refine file type settings under Advanced > File Types, selecting "Properties Only" instead of "Properties and File Contents" for specific file extensions to cut down on disk activity. -
Rebuild or Disable the Index:
If the index is corrupted or continues to cause problems, rebuild it by going to Indexing Options > Advanced and clicking Rebuild to start fresh. To disable indexing altogether, openservices.msc, find Windows Search, right-click to access Properties, set the Startup type to Disabled, and click Stop.
After making changes, monitor system performance to ensure everything runs smoothly.
Monitoring Indexing Activity with MetricFire
MetricFire can help you monitor disk activity and identify spikes caused by searchindexer.exe. By creating custom Grafana dashboards, you can track metrics like disk active time, queue length, and response times across your Windows systems. Set up alerts to notify your team if disk usage caused by indexing exceeds normal levels - for instance, if disk active time stays above 80% for more than 10 minutes during peak hours.
With MetricFire, you can quickly pinpoint whether indexing is affecting productivity and take action to resolve the issue. This tool is particularly useful for IT teams managing multiple devices.
To learn more about optimizing disk performance with MetricFire, book a demo at MetricFire Demo.
3. SysMain or Superfetch Background Activity
SysMain, previously called Superfetch, is a Windows service designed to analyze your computer usage patterns and preload frequently used applications into your RAM. While the idea is to improve performance by making apps launch faster, the service still runs in the background. This can cause disk usage spikes that reach 100%, causing your system to stutter, freeze, or slow down as the disk becomes too busy to handle other tasks.
The situation is particularly problematic for systems with mechanical hard drives, where SysMain’s constant disk reads interfere with other processes, causing noticeable performance degradation. On SSDs or M.2 drives, the effects are less severe, but the service still generates unnecessary write operations. As Shawn Brink, a Performance & Maintenance Expert at TenForums, points out:
If you run Windows from a SSD or M.2 instead of a slow spinner hard drive, then you may not see any performance gain from SuperFetch to justify the drive usage from it.
Now, let’s take a closer look at how SysMain contributes to high disk usage.
How SysMain Affects Disk Usage
SysMain continuously reads data from disk to preload applications into memory. Although it prioritizes unused memory, the constant activity keeps the disk busy. Many users report seeing disk usage stuck at 90% or higher in Task Manager, with "Service Host: SysMain" often listed as the top consumer. Additionally, some users have observed SysMain taking up 10–15% of CPU resources on modern systems.
The service was renamed from Superfetch to SysMain starting with Windows 10 build 17763.1 (version 1809), but its core functionality - and the potential for performance issues - remains the same.
Managing SysMain effectively can help reduce disk load and improve system responsiveness.
How to Disable or Optimize SysMain
Disabling SysMain is safe and won’t harm your Windows installation, though you might notice slightly slower application launch times. Here’s how you can turn it off or adjust its behavior:
Disable via Services Console:
-
Press
Win + R, typeservices.msc, and hit Enter. - Find SysMain, right-click on it, and select Stop.
- Right-click it again, choose Properties, set the Startup type to Disabled, and click OK.
Disable via Command Prompt:
Run the following command in an elevated Command Prompt:
sc stop "SysMain" & sc config "SysMain" start=disabled
Optimize via Registry Editor:
For more granular control, go to:
HKEY_LOCAL_MACHINE\SYSTEM\CurrentControlSet\Control\Session Manager\Memory Management\PrefetchParameters
Adjust the EnableSuperfetch DWORD value as follows:
-
0to disable -
1for applications only -
2for boot files only -
3(default) for both
If you’re using a mechanical hard drive and still experiencing issues, upgrading to an SSD is often the best long-term fix.
Using MetricFire for Service-Level Monitoring
To better understand SysMain’s impact, you can use MetricFire to monitor key metrics like Disk I/O, response times, and disk queue length. By tracking Disk I/O (Total B/sec), Response Time (ms), and Disk Queue Length, you can identify when SysMain is causing performance issues. You can also set alerts for sustained disk utilization above 90%.
MetricFire’s Grafana dashboards make it easy to see if SysMain is the top disk writer during idle times. This is especially useful for IT teams managing multiple Windows systems, as it allows them to detect and address SysMain-related slowdowns before users notice any issues.
Want to give MetricFire a try? Sign up for a free trial or book a demo here:
https://www.metricfire.com/demo/.
4. Disk Fragmentation
Disk fragmentation occurs when file fragments are stored in different locations on a hard drive rather than being kept together. This forces the drive's read/write heads to move around to access data, reducing performance. On mechanical hard drives, this can be a major issue. As Craig Marcho from Microsoft explains, when file data is stored in adjacent clusters, "the mechanical components of the hard disk work very efficiently, pulling the data in one operation". But when files are fragmented, the heads need to move between distant locations, increasing seek time. This can lead to slower application launches, longer boot times, and an overall sluggish system.
It's important to note that SSDs don’t benefit from defragmentation. Their non-mechanical design means fragmentation doesn’t affect them, and defragmenting an SSD can actually reduce its lifespan by wasting write cycles.
What Is Disk Fragmentation
Fragmentation occurs naturally over time as files are saved, deleted, or modified. To prioritize speed when writing files, the operating system places data in the first available block, which eventually results in scattered fragments. For example, on NTFS disks with a capacity of 2,049MB or more, the default cluster size is 4,096 bytes (4KB). Even system metadata, such as the Master File Table, can become fragmented, further slowing file retrieval. Experts suggest defragmenting a disk when fragmentation reaches 10% or at least once a month.
How to Defragment Your Disk
Windows 10 and 11 come with a built-in tool called "Defragment and Optimize Drives" that automatically optimizes disks on a weekly schedule. If you want to defragment your hard drive manually, follow these steps:
- Search for "defrag" in the Windows taskbar and open the tool.
- Select your HDD, then click Analyze to check the level of fragmentation.
- If optimization is needed, click Optimize to begin the process.
Before starting, close any background programs and empty your Recycle Bin. Also, ensure you have at least 15% free disk space, as Windows requires this to complete the defragmentation process.
You can also schedule automatic maintenance. Within the Optimize Drives tool, ensure scheduled optimization is enabled and set the frequency to daily, weekly, or monthly. The tool automatically detects SSDs and performs TRIM operations instead of defragmentation.
For those who prefer command-line tools, you can use defrag /a to analyze a volume without making changes. If errors appear on the volume, run chkdsk.exe before attempting to defragment.
After defragmenting, check whether the process improved your disk’s performance.
Monitoring Performance After Optimization
Once you’ve defragmented your disk, it’s a good idea to measure the performance impact. Tools like MetricFire can help you monitor key metrics such as Disk Queue Length, Transfer Time, and Physical Disk Activity (reads/writes per second).
Using MetricFire’s Grafana dashboards, you can visualize performance trends before and after defragmentation. Track metrics like average disk response time and IOPS (Input/Output Operations Per Second) to see if optimization made a difference. MetricFire also offers an alerting system that notifies you of any performance drops caused by fragmentation, so you can address issues before they affect users.
You can try MetricFire with a free trial or book a demo to discuss your specific monitoring needs with their team.
5. File System Errors and Bad Sectors
File system errors (logical issues) and bad sectors (physical damage) can overwhelm storage by causing repeated I/O retries. These problems, much like other disk-related issues, slow down performance and demand quick attention.
You might notice symptoms like delayed file access, sluggish boot times, frequent system freezes, corrupted or missing files, and even data loss. On traditional hard drives, bad sectors can produce audible clicking or grinding sounds. If NTFS file system corruption prevents updates to the transaction log, it might block rollbacks of failed operations, leading to permanent data loss.
How to Identify File System Errors
Windows Event Viewer is a great starting point for spotting file system errors. Head to Windows Logs > Application, then filter for sources like Chkdsk and Wininit to find detailed scan results. Pay attention to Event IDs that signal disk health problems:
| Event ID | Meaning | Action |
|---|---|---|
| 55 | File system structure is corrupt | Run chkdsk /f |
| 98 | Volume needs to be taken offline | Run chkdsk /f or Repair-Volume |
| 153 | I/O operation was retried | Inspect subsystem or cables for damage |
| 129 | Reset to device (timeout) | Check storage network stability |
| 157 | Disk surprise removed | Verify physical connections and hardware |
To check if a volume has been flagged as "dirty" (indicating corruption), use the command fsutil dirty query <VolumePath>: in the command prompt. A clean file system should show 0 KB in bad sectors in the scan log. Any positive value means the disk might be failing and could need replacement.
How to Repair Errors and Bad Sectors
Before starting any repairs, back up important data to avoid losing it, especially if the drive is heavily damaged. Then follow these steps:
-
Run
sfc /scannowto repair system files. -
Use
DISM /Online /Cleanup-Image /RestoreHealthto fix issues with the Windows image. -
Execute
chkdsk /f /rto address both logical errors and bad sectors. The/fflag fixes logical errors, while/ridentifies and recovers data from bad sectors. If the volume is in use, the scan will be scheduled for the next reboot.
For NTFS volumes, you can perform an online scan using chkdsk /scan, which avoids taking the drive offline. If you need a deeper cleanup, try chkdsk /b to clear bad cluster records and rescan the volume. On SSDs, while chkdsk operates more quickly due to the absence of mechanical parts, excessive full-surface scans can increase write/erase cycles, slightly impacting the SSD's lifespan.
Using MetricFire for Error Detection
System tools are helpful, but proactive monitoring can give you an edge. MetricFire lets you detect disk issues early, long before they escalate into system failures. By tracking disk I/O patterns, MetricFire can identify warning signs like I/O retries (Event ID 153) or timeouts (Event ID 129), which often occur before noticeable performance drops.
With MetricFire, you can set up alerts to notify you when disk error rates spike or when I/O response times exceed normal levels. Using Grafana dashboards, you can visualize long-term trends in disk health and link them to specific system events. This proactive strategy allows you to plan maintenance during low-usage periods, avoiding costly emergency downtime.
Ready to get started? Sign up for a free trial (https://www.hostedgraphite.com/accounts/signup/) or book a demo (https://www.metricfire.com/demo/) to discuss your monitoring needs with the MetricFire team.
How to Prevent Disk Usage Issues
To keep your system running smoothly, regular maintenance and proactive monitoring are essential. These steps can help you avoid future disk usage problems.
Regular Maintenance Tasks
Staying ahead of disk issues is much easier than fixing them later. Routine cleanup and optimization can stop problems before they start.
-
Automate Cleanup: Use tools like Windows Storage Sense to clear temporary files and empty the Recycle Bin automatically. You can also run
cleanmgr.exeto remove system files, downloaded program files, and thumbnails. For Windows Server 2025,cleanmgr /VERYLOWDISKcan delete junk files without requiring user input. -
Check System Health: Regularly run commands like
sfc /scannow,DISM /Online /Cleanup-Image /RestoreHealth, andchkdsk /fto repair corrupted system files and fix NTFS errors. These steps prevent excessive disk activity caused by underlying issues. - Upgrade to SSDs: If you're still using traditional hard drives, switching to SSDs can dramatically reduce disk usage problems. Older PCs with 5,400 RPM HDDs are far more prone to performance bottlenecks.
- Free Up Space: Enable OneDrive Files On-Demand to store placeholder files locally while keeping full versions in the cloud. Move large, rarely used files to external drives, and adjust default save locations for apps and documents to prevent your main OS drive from filling up (Settings > System > Storage > Advanced storage settings).
Monitoring with MetricFire
Routine maintenance is essential, but monitoring tools like MetricFire provide an extra layer of protection by identifying potential issues early.
- Track Disk Usage Trends: MetricFire monitors disk space and alerts you before usage exceeds safe thresholds. For example, you can set alerts to notify you when available space drops below 10–15%.
- Real-Time Notifications: Integrate MetricFire with tools like PagerDuty and Slack to receive immediate alerts when disk usage crosses critical levels, such as 85%. This gives you time to act before hitting the danger zone of 95–98%, where performance issues are likely.
-
Monitor Specific Directories: Keep an eye on directories like
/var/logor application datastores to avoid unexpected shutdowns caused by log file overflows. MetricFire also tracks disk I/O patterns, helping you spot abnormal behavior early. For instance, it can reveal how background processes like Windows Search Indexing or SysMain impact disk performance, allowing you to optimize or disable them as needed.
By combining regular maintenance with proactive monitoring, you can prevent the disk issues discussed earlier and maintain consistent system performance.
Explore MetricFire's capabilities with a free trial or schedule a demo.
Conclusion
Disk usage problems can slow down systems and even cause crashes, but tackling issues like overutilization, indexing, background services, fragmentation, and file system errors can bring back performance. Often, high disk usage stems from hardware limitations - upgrading to an SSD is a highly effective solution for resolving 100% disk usage. On older machines, services like Windows Search Indexing and SysMain, though designed to improve performance, can lead to high I/O spikes. Disabling or fine-tuning these through the Services management console (services.msc) can make a noticeable difference. For traditional hard drives, regular defragmentation can help, while running commands like chkdsk /f /r can address file system errors and bad sectors, preventing potential data loss.
Leo A. Notenboom, Founder of Ask Leo!, highlights this common issue:
100% disk usage is common, but typically only under certain conditions and only for 'a while'.
When disk activity reaches maximum, programs compete for resources, often causing system freezes.
Proactive maintenance is key. Automating cleanup tasks, managing logs, and monitoring system health can help prevent disk-related issues. Tools like MetricFire are invaluable here, providing real-time insights and alerts. By setting thresholds - such as warnings at 80–85% usage and critical alerts at 90–95% - you can act before performance hits rock bottom.
MetricFire’s dashboards allow you to track disk I/O latency and plan capacity effectively. With over 800 integrations and up to two years of data retention, it offers the historical data you need to make smarter decisions.
Ready to take control of your system’s performance? Start a free trial at Hosted Graphite or book a demo to discuss your monitoring needs with the MetricFire team.
FAQs
What steps can I take to avoid disk overutilization?
Keeping your storage in check is all about staying ahead of potential issues. Start by regularly monitoring your disk usage. This helps you spot problems early before they spiral out of control. Use tools or monitoring platforms to track storage trends, and don’t forget to hunt down large or unnecessary files that might be hogging space.
Another effective tactic is setting up automated cleanup routines. These can handle tasks like deleting temporary files, clearing out old logs, or removing unused backups. It’s a simple way to keep your system clutter-free without constant manual intervention.
You can also tweak your system for better efficiency. Disabling unnecessary background processes, like indexing or prefetching, can lighten the load on your disk. If you’re looking for a performance boost, upgrading to faster storage options like SSDs can make a world of difference by reducing bottlenecks.
For a more comprehensive solution, consider using monitoring tools like MetricFire. These tools let you track disk metrics and send alerts if something unusual pops up. By combining these strategies, you’ll keep your disks running smoothly and avoid the headaches of overutilization.
What advantages does MetricFire offer for monitoring disk usage?
MetricFire offers a straightforward and effective way to monitor disk usage. Through its centralized platform, you can gather, visualize, and analyze disk metrics effortlessly with customizable dashboards powered by Graphite and Grafana. These tools make it easy to keep an eye on disk space, spot overused partitions, and address potential problems before they disrupt your system's performance.
On top of that, MetricFire’s alerting system ensures your team stays informed when disk usage reaches critical levels. These timely notifications enable quick action, helping you avoid downtime or system failures. With real-time insights into disk health and usage trends, MetricFire supports system stability and keeps your infrastructure running efficiently.
Why don’t SSDs need to be defragmented?
SSDs (solid-state drives) function differently from traditional HDDs (hard disk drives) because they use flash memory to access data electronically, rather than relying on spinning disks. This design means file fragmentation doesn’t impact their performance.
In fact, defragmenting an SSD can actually shorten its lifespan. Since SSDs have a limited number of write cycles, the additional write operations involved in defragmentation can cause unnecessary wear and tear. Fortunately, modern operating systems are built to optimize SSD performance without the need for defragmentation.
Sign up for the free trial and begin monitoring your infrastructure today. You can also book a demo and talk to the MetricFire team directly about your monitoring needs.

