Table of Contents
- Monitoring Checklist for Cloud Infrastructure - Why It Matters: - Key Metrics to Track: - Tools to Consider: - Quick Start Tips:
Great systems are not just built. They are monitored.
MetricFire is the fully managed Graphite and Grafana platform for small teams that don’t want to self-host their monitoring stack. Pre-built dashboards, alerts, and native add-ons for Heroku, AWS, Azure, and GCP. All with dedicated support and no infrastructure to maintain.
Monitoring Checklist for Cloud Infrastructure
Cloud monitoring is essential for tracking performance, security, and costs in dynamic environments. With 94% of enterprises using cloud services and 81% adopting multi-cloud setups, maintaining control is critical. Here's what you need to know:
Why It Matters:
- Avoid Downtime: Proactively resolve issues before they escalate.
- Optimize Costs: Prevent 30% of cloud spending from going to waste.
- Enhance Security: Monitor access, vulnerabilities, and compliance.
Key Metrics to Track:
- System Performance: CPU, memory, disk I/O, response times.
- Network Health: Bandwidth, latency, packet loss.
- Security: Access logs, encryption, unpatched vulnerabilities.
Tools to Consider:
- AWS CloudWatch: Best for AWS ecosystems.
- MetricFire: Managed solution for simplified operations.
- Grafana + Prometheus: Flexible, cost-effective for multi-cloud.
Quick Start Tips:
- Set clear goals and metrics aligned with business needs.
- Automate monitoring with tools like Kubernetes DaemonSets.
- Use AI to generate predictive insights and detect issues faster.
Stay ahead by regularly auditing your monitoring strategy and training your team. A solid plan ensures better performance, security, and cost management.
Basics of Amazon CloudWatch and CloudWatch Metrics
Key Cloud Metrics to Track
Keeping tabs on essential metrics across systems, networks, and security helps maintain optimal performance, safeguard data, and manage costs effectively. Below, we break down the key areas to monitor: system performance, network health, and security.
System Performance Tracking
System metrics give insight into capacity issues and performance trends. For instance, tracking CPU utilization can help identify bottlenecks, while monitoring memory usage ensures your system doesn't slow down due to excessive I/O operations.
Here are the primary metrics to watch:
- CPU Load Average: Monitor the 1-, 5-, and 15-minute averages to understand workload trends.
- Memory Usage: Measure both used and available memory, including swap space.
- Disk I/O Performance: Track read/write latency and IOPS to assess storage efficiency.
- Application Response Times: Monitor service delivery to ensure applications are running smoothly.
Network Health Checks
Network performance is just as critical as system metrics. Poor network health can severely impact service availability and user experience. Focus on these areas:
- Bandwidth Usage: Analyze inbound and outbound traffic to avoid congestion.
- Network Latency: Measure round-trip times (RTT) between cloud resources to detect delays.
- Packet Loss: Evaluate the reliability of data transmission.
For example, high bandwidth usage often signals network congestion, which can lead to slower data transfers and higher latency.
Security Monitoring
Security metrics are indispensable for protecting sensitive data and ensuring compliance. With organizations using over 100 cloud applications daily, security monitoring has become more intricate. Tools like Bitsight, trusted by 25% of Fortune 500 companies, highlight the importance of tracking security data.
"Cloud security metrics are data points that organizations can use to monitor, measure, and mitigate risk in cloud-hosted assets."
Key security metrics include:
| Category | What to Monitor |
|---|---|
| Access Control | Logins, privileged access events, unauthorized attempts |
| Data Protection | Sensitive data exposure, encryption, and external access |
| Infrastructure Security | Open ports, botnet infections, and unpatched vulnerabilities |
| Compliance | Policy violations, certification statuses, vendor ratings |
Automated tools like Cloud Access Security Brokers (CASBs) simplify continuous monitoring and alerting, making it easier to stay ahead of potential risks.
Creating Your Monitoring Plan
Managing cloud infrastructure effectively starts with a well-thought-out monitoring plan. This involves setting clear goals, configuring alerts, and defining incident response steps.
Setting Goals and Metrics
Define specific performance benchmarks that align with your business priorities.
| Goal Category | Key Considerations | Example Metrics |
|---|---|---|
| Performance | System responsiveness | Response times, throughput |
| Reliability | Service availability | Uptime %, error rates |
| Security | Compliance requirements | Access attempts, policy violations |
| Cost Optimization | Resource utilization | CPU usage, storage consumption |
For industries with strict regulations, automated monitoring is a must. Once your goals are defined, the next step is to set up an alert system to ensure timely notifications.
Alert System Setup
Managing alerts effectively helps avoid both missed incidents and excessive notifications.
"For redundancy purposes, we recommend that you create multiple types of notification channels." – Google Cloud
EveryMon’s method reduces alerts by over 85% while still delivering critical notifications. Here’s how to configure your alerts:
- Define thresholds: Use historical performance data to set realistic limits.
- Prioritize notifications: Create hierarchies to manage urgency levels.
- Use redundant channels: Combine email, SMS, and team tools for reliability.
- Include debugging details: Add context to notifications for quicker issue resolution.
For example, Google Cloud's Apigee platform can monitor specific metrics, such as 5XX error rates exceeding 300 within a 5-minute period. Once alerts are in place, focus on creating an efficient incident response plan.
Incident Response Steps
A structured approach to incident response ensures issues are handled promptly and effectively:
-
Preparation Phase
- Implement detailed logging systems.
- Train your team on the use of cloud-specific tools.
-
Detection and Response
- Use automated detection tools for faster identification.
- Leverage frameworks like CIS Controls and the MITRE ATT&CK Matrix.
-
Resolution and Recovery
- Isolate impacted systems to prevent further damage.
- Apply containment measures and restore from secure backups.
- Verify that all security controls are functioning correctly.
Popular Monitoring Tools
Selecting the right monitoring tool is crucial for managing your cloud infrastructure effectively. Here’s a closer look at three platforms, each offering distinct features.
MetricFire
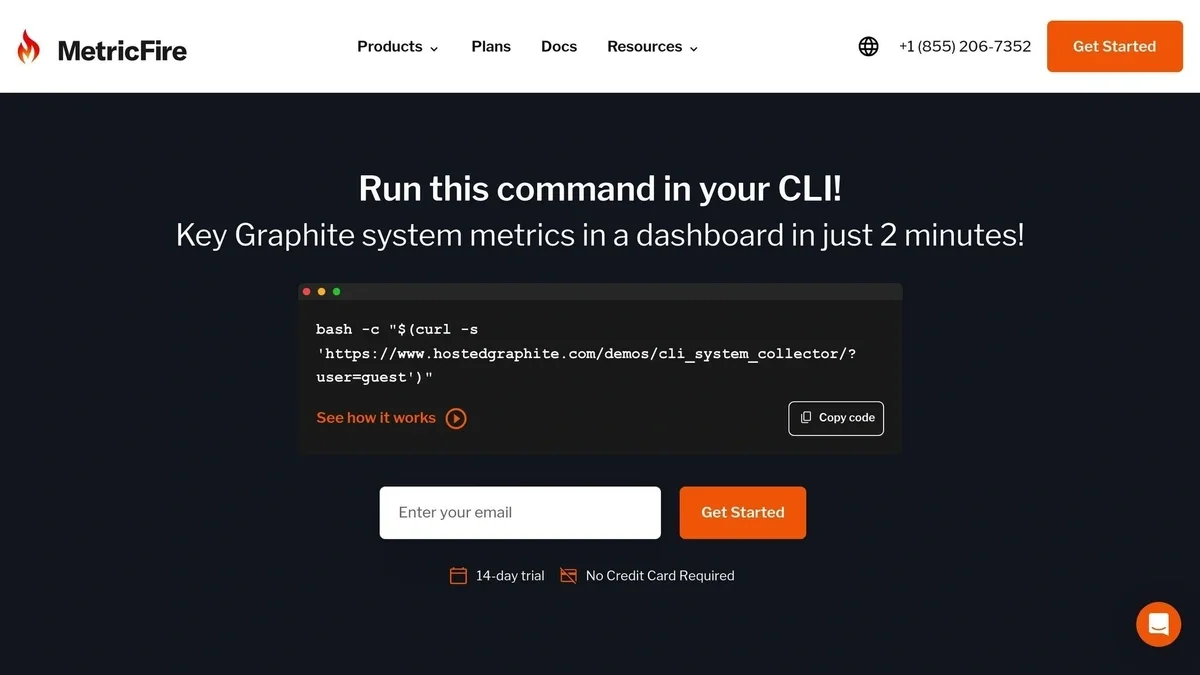
MetricFire offers a managed monitoring service built on Graphite and Grafana, making it a great choice for organizations preferring a hands-off approach. Key features include:
- Enterprise-level support: Dedicated clusters and 24/7 assistance for large deployments.
- Broad monitoring: Covers cloud, database, and Kubernetes environments.
- Integration-ready: Works with popular alerting tools like PagerDuty, Slack, and webhooks.
Pricing starts at $19 per month for the Into Plan (250 metrics, Kubernetes monitoring, 2 users, 10 alerts, 6 months retention). The Basic Plan, at $99 per month, includes 1k metrics, Kubernetes monitoring, unlimited users, unlimited alerts, and 24 months of retention, making it a solid option for small to mid-sized organizations.
Each tool has its strengths: CloudWatch is tailored for AWS environments, Grafana/Prometheus offers unmatched flexibility for multi-cloud setups, and MetricFire simplifies operations with a managed service. Choose based on your specific infrastructure and operational needs to build a strong monitoring framework.
AWS CloudWatch
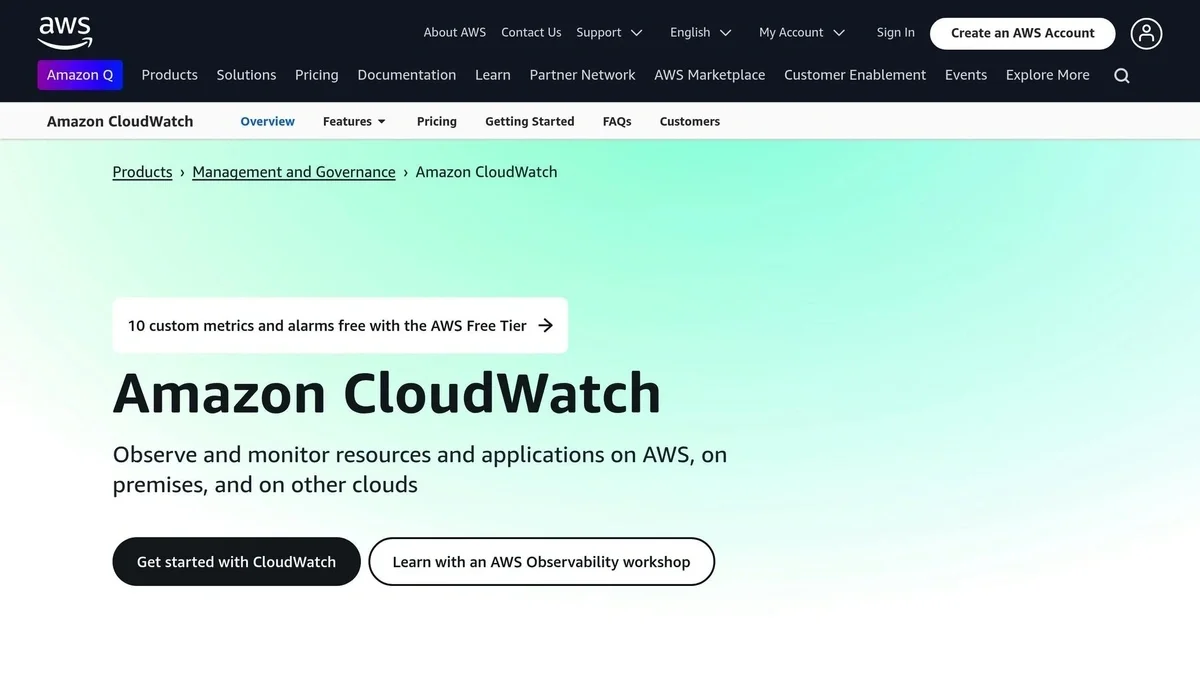
AWS CloudWatch provides extensive monitoring for AWS services. Key highlights include:
- Granular metrics: Data visibility as frequent as every second, with a 15-month retention period.
- Wide integration: Works seamlessly with over 70 AWS services, including API Gateway, Lambda, and CloudTrail.
- Hybrid support: Enables monitoring across hybrid and multi-cloud setups using CloudWatch connectors.
"CloudWatch allows overlaying data from multiple sources onto the same graphs and dashboards without duplicating metrics or switching tools" – AWS Documentation.
However, costs can escalate for larger deployments. For instance, monitoring a 100-node cluster may cost about $8,664 per month. This tool is a strong choice for AWS-focused environments.
Grafana and Prometheus
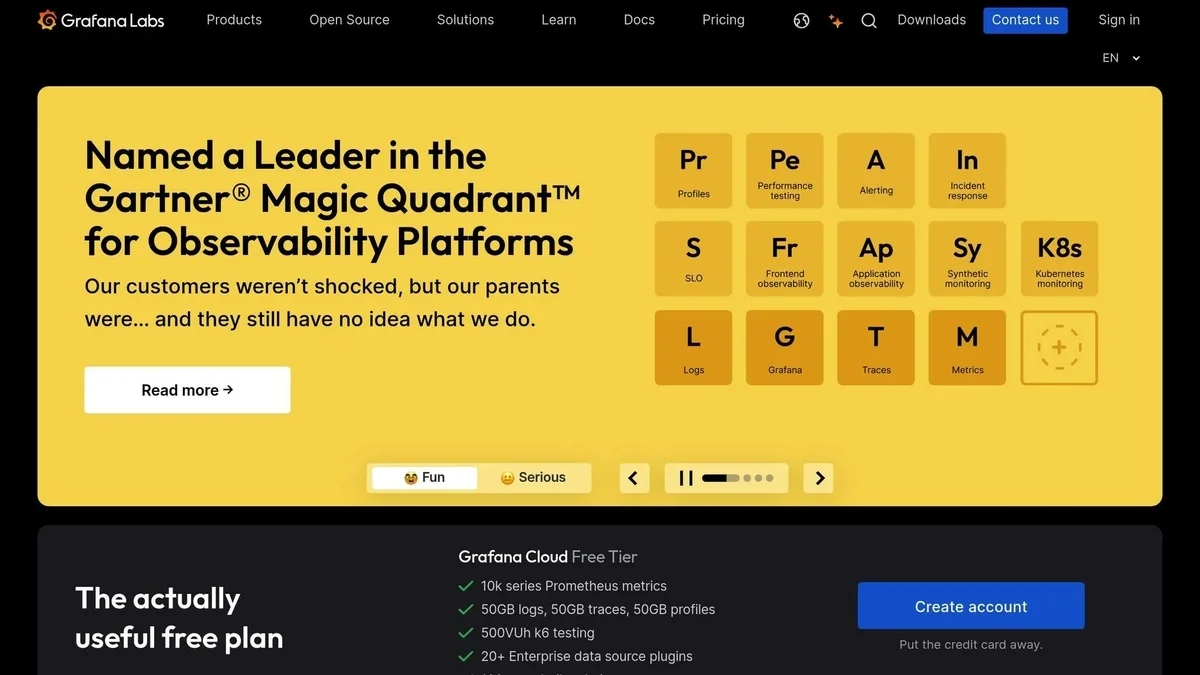
Prometheus specializes in collecting and storing metrics, while Grafana excels in creating detailed dashboards. This combination works particularly well for Kubernetes monitoring.
Core functionalities comparison:
| Feature | Prometheus | Grafana |
|---|---|---|
| Primary Function | Metric collection and storage | Data visualization and dashboards |
| Query Language | PromQL | Supports multiple data sources |
| Visualization | Basic expression browser | Advanced, customizable dashboards |
| Alerting | Via Alertmanager | Built-in alerting system |
For a 100-node cluster, a self-hosted Prometheus setup is much more budget-friendly than CloudWatch, costing about $3,146 monthly. This setup is ideal for those seeking flexibility and powerful querying options in multi-cloud environments.
Monitoring Tips and Methods
Monitoring Automation
Automated monitoring reduces manual work and speeds up issue resolution.
For Kubernetes, DaemonSets can automatically deploy monitoring agents across all nodes. This ensures hardware metrics and logs are captured as the cluster grows.
Here are some key strategies for automation:
- Infrastructure-as-Code Integration: Build monitoring capabilities directly into applications during the design phase.
- Resource Classification: Group cloud resources into categories for more precise monitoring.
- Container Standardization: Use containers to maintain consistent monitoring environments.
Multi-Cloud Monitoring
With 89% of enterprises now using multi-cloud strategies, cross-platform monitoring is more important than ever. Unified observability platforms can break down data silos and provide a complete view of operations.
Here’s how companies are optimizing multi-cloud monitoring:
| Company Type | Solution Used | Results Achieved |
|---|---|---|
| BFSI Firm | Ansible Automation | 70% faster security updates |
| E-commerce Platform | Terraform | Regional storefront launches reduced from weeks to days |
| Gaming Company | Dynatrace | Improved player retention with AI-driven insights |
In addition to unified observability, advanced AI techniques are making monitoring even more precise.
Using AI for Monitoring
AI-driven monitoring adds predictive insights to existing automation and multi-cloud practices. The predictive analytics market is expected to grow from $11.5 billion in 2023 to $28 billion by 2028.
Some real-world examples include:
- Netflix: Uses AI to analyze billions of metrics daily and predict service disruptions.
- Amazon: Employs predictive monitoring to identify bottlenecks in microservices.
- ASOS: Leverages Microsoft Azure's AI to manage server loads during peak shopping times.
Organizations using AI-powered monitoring have reported a 25% drop in unplanned outages. However, implementing AI comes with challenges:
- Data Quality: Ensure data collection and validation processes are solid.
- Algorithm Bias: Regularly audit models with diverse datasets.
- Skill Gaps: Train employees or collaborate with experienced vendors.
These approaches can strengthen your monitoring strategy as you move forward.
Conclusion
Checklist Review
Make it a habit to review and update your monitoring checklist regularly. This helps you stay aligned with evolving operational needs and technological advancements. Pay attention to key areas like infrastructure performance, security protocols, cost management, and the tools you rely on. Aim to conduct these reviews every quarter or twice a year to ensure your checklist reflects current priorities.
Use these insights to guide your next steps.
Next Steps
Here are three areas to focus on for a well-maintained monitoring system:
-
Regular Audits and Updates
Go over your checklist routinely to spot weaknesses and make necessary updates. -
Team Collaboration and Training
Encourage teamwork among development, security, and operations teams. This ensures your monitoring practices align with business objectives. Regular training sessions and feedback loops help keep strategies relevant. -
Continuous Optimization
Concentrate on the metrics that matter most for performance and cost. Use feedback from audits to refine your approach and prioritize the indicators that drive results.
Sign up for the free trial and begin monitoring your infrastructure today. You can also book a demo and talk to the MetricFire team directly about your monitoring needs.


