
Table of Contents
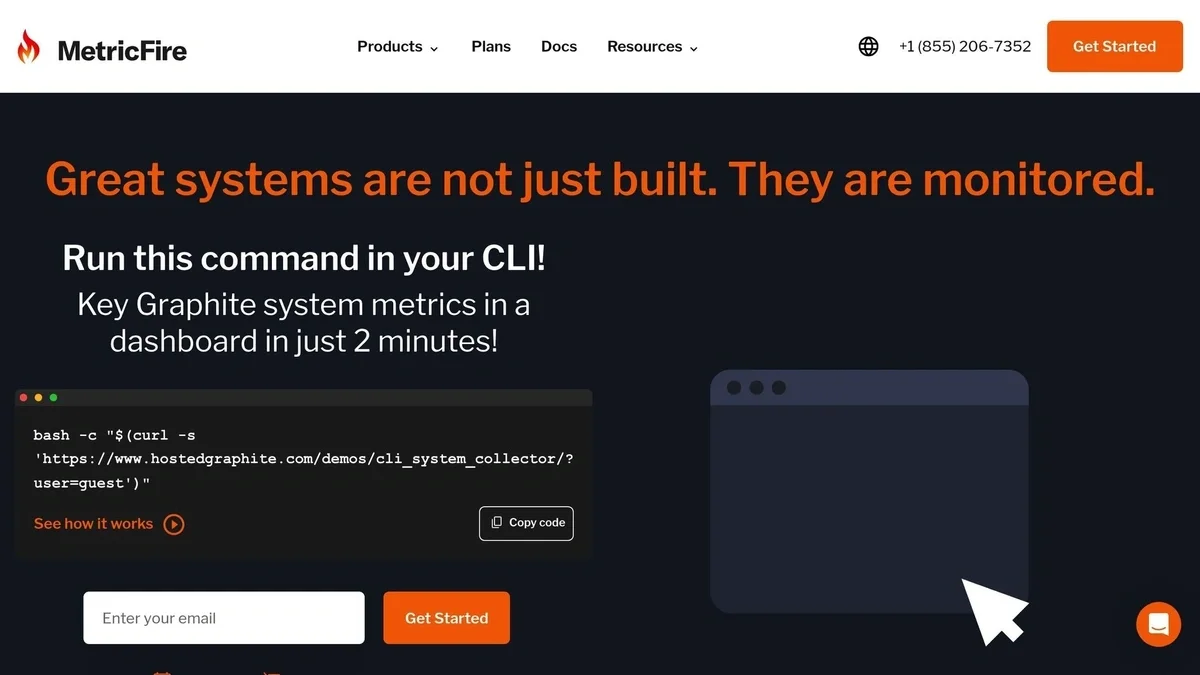
Great systems are not just built. They are monitored.
MetricFire is the fully managed Graphite and Grafana platform for small teams that don’t want to self-host their monitoring stack. Pre-built dashboards, alerts, and native add-ons for Heroku, AWS, Azure, and GCP. All with dedicated support and no infrastructure to maintain.
How to Set Up Effective Alert Thresholds in Graphite
Setting up alert thresholds in Graphite transforms raw monitoring data into actionable notifications, helping you address system issues before they escalate. Here's what you need to know:
- Alert Timing Matters: Graphite's ingestion-based alerts are faster than render-based systems, triggering notifications in near-real-time.
- Key Setup Requirements: Ensure Graphite is fully operational with Carbon, Whisper, and a data collector running smoothly. Use tools like Grafana for visualization if needed.
- Choosing Metrics: Focus on metrics that reflect user experience, such as latency or error rates, and differentiate between warning (e.g., 80% CPU usage) and critical thresholds (e.g., 95% CPU usage).
-
Threshold Configuration: Use Graphite's flexible options like single-bound thresholds, range-based alerts, or anomaly detection and missing data detection. Adjust for noise with functions like
movingAverage()and set hysteresis to avoid repetitive alerts. - Testing Alerts: Always test thresholds in a controlled environment to fine-tune settings and reduce false positives. Review historical data to validate configurations.
-
Dynamic Adjustments: Use tools like
timeShift()andholtWintersConfidenceBands()to set baselines and dynamic thresholds for seasonal trends.
For notifications, Graphite integrates with channels like Slack, PagerDuty, and email. Use "On state change" to reduce redundant alerts and include troubleshooting steps for quick action. Regularly review and adjust thresholds to maintain effectiveness.
Graphite's alerting system ensures faster responses and prioritizes user-facing issues, helping you maintain system health without overwhelming your team.
Prerequisites for Configuring Alert Thresholds
To set up effective alert thresholds in Graphite, you need a functioning monitoring system. This includes Graphite installed and collecting metrics, a visualization tool to handle alerts, and the necessary permissions to make configuration changes. Without these essentials, your alerts won’t work as intended. A proper setup ensures raw data can be turned into actionable alerts, as outlined earlier. These steps form the backbone of a smooth alert threshold configuration process.
Setting Up Graphite and Metric Data
First, make sure all Graphite components are running smoothly. This includes Carbon (for data ingestion), Whisper (for storage), and a data collector that sends metrics to Carbon on TCP port 2003. Configuration files like carbon.conf and storage-aggregation.conf need to be properly set up. Use the "Check Metric Graph" button to confirm that metrics are flowing correctly. Reliable and consistent data is critical - any gaps or irregularities in your metrics can disrupt alert triggers.
Once the data flow is verified, the next step is to integrate a visualization tool like Grafana for easier alert management.
Integrating Graphite with Grafana
To connect Grafana with Graphite, add Graphite as a data source using its URL and credentials. It’s worth noting that Graphite’s ingestion-based alerting is faster than Grafana’s render-based system. Both platforms offer alerting features, but they use different alerting engines. One important detail: alerts created in the Grafana Dashboard UI cannot be edited or deleted from the Hosted Graphite UI. Decide where you want to manage alerts long-term before choosing your alert creation method.
Ensuring Proper Access and Permissions
Administrative permissions are required to configure notification channels and alerts. If you plan to automate tasks using the Graphite Alerts API, request an API key with access limited to authorized users. For consistent team management, check whether existing alerts were created in the Graphite UI or Grafana, as they can only be managed through their original interface. In team environments, it’s best to set up notification channels (like Slack, PagerDuty, or webhooks) at the admin level. This allows users with standard permissions to select these channels when defining their own thresholds.
How to Set Up Alert Thresholds
Once your setup is complete, you’re ready to create alerts. This involves choosing the right metrics, defining threshold values, and testing thoroughly before deploying them. Using the Hosted Graphite UI, you can configure alert triggers and define who should be notified.
Selecting Metrics for Alerting
Start by identifying metrics that provide actionable insights for your monitoring goals. Focus on metrics that reflect user experience - prioritize symptoms like API latency or error rates rather than internal signals such as pod restarts. While infrastructure metrics like CPU and memory usage can act as early warning signs, they are most effective when paired with symptom-based alerts to pinpoint root causes.
"Alerts should primarily detect user-facing failures, not internal component behavior. Users don't care that a pod restarted; they care when the application is slow or failing." - Grafana Documentation
It’s essential to distinguish between warning alerts and critical alerts from the start. Critical alerts should indicate immediate issues affecting users and require action within minutes. Warnings, on the other hand, serve as early indicators of potential problems that can be addressed during regular hours. For instance, you might set a warning at 80% CPU usage and a critical alert at 95%, giving your team a chance to respond before performance is impacted.
Configuring Thresholds and Evaluation Parameters
To create a new alert, open the Alert panel and select Create New Alert. Use a clear and descriptive name like "Production API Response Time" to avoid confusion. In the Metric Pattern field, input your query. This field supports wildcards (e.g., servers.*.cpu) and tagged metrics (e.g., seriesByTag("name=app.resp")).
Under the Alert Criteria tab, select the type of trigger that fits your needs. Options include:
- Above/Below a Threshold: For single-bound metrics like CPU load.
- Outside of Bounds: For metrics with range-based thresholds, such as response times.
- Missing Data: To detect system outages.
Set numerical thresholds based on your metric’s behavior. For example, you might configure a warning at 350ms and a critical threshold at 700ms for API latency, using the 95th or 99th percentile.
Adjust the Time Period to require sustained breaches (e.g., 5 minutes) to filter out short-lived spikes, based on 30-second data point averages. Use the "Check Metric Graph" feature to confirm your query displays the expected results before saving.
To avoid false triggers, wrap intermittent metrics with functions like transformNull() or keepLastValue(). In the Alert Info section, include troubleshooting steps or links to runbooks for on-call engineers. Avoid using double quotation marks in descriptions, as they can cause issues with JSON payloads for Slack webhooks.
Once thresholds are set, proceed to test the alert configuration.
Testing and Enabling Alerts
After configuring thresholds, test the alert setup in a controlled environment. Use the alert overview popup to review its embedded graph and 3-day history log. This helps you determine how often the threshold has been breached in the past, allowing you to fine-tune settings and reduce false positives. You can also view metrics on a Graphite dashboard, where alert events appear as annotations. Comparing these annotations with historical data helps ensure your thresholds are realistic.
Set the Notification Interval to a fixed period (e.g., every 5 minutes) to avoid overwhelming your team with alerts. Choose a notification channel (such as Email, Slack, or PagerDuty) and save the alert. Initially, it will appear in the "Healthy" list until data triggers a state change. Monitor the alert’s behaviour over several days and adjust thresholds as necessary. Keep in mind that manually updating criteria will reset the alert to "Healthy", but it will return to "Triggered" if the next data point breaches the threshold.
Optimizing Alert Thresholds for Key Metrics
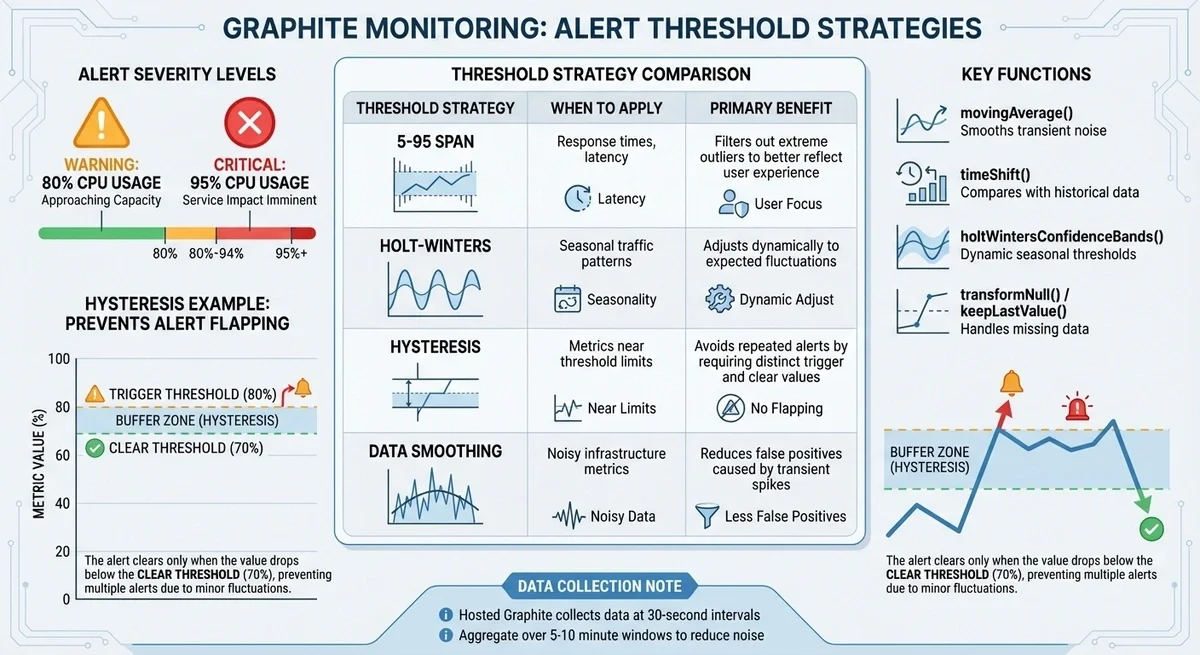
Graphite Alert Threshold Strategies and Configuration Guide
Defining Baselines and Dynamic Thresholds
Setting accurate baselines is crucial for avoiding false alarms while ensuring real issues are detected. A 5-95 span is a useful way to filter out extreme response-time values. By focusing on the range between the 5th and 95th percentiles, you eliminate outliers that don't reflect typical user experiences. As software engineer Matt Aimonetti puts it:
"A 5-95 span means that we cut off the extreme outliers above 95% and below 5%... it's also more representative of the real user experience and thus more valuable."
For comparing current metrics with historical data, Graphite's timeShift() function is a handy tool. For instance, using timeShift(series, "1w") overlays data from the previous week, helping you identify whether a CPU spike is part of a recurring trend or an actual anomaly. For metrics with seasonal patterns, you can apply Holt-Winters forecasting using holtWintersConfidenceBands(). This method sets dynamic thresholds that are triggered only when values deviate significantly from expected trends.
When monitoring capacity metrics like memory consumption, the currentAbove(seriesList, n) function can help by alerting based on the most recent value rather than an average. For count-based metrics, such as transaction volumes, using consolidateBy(series, 'sum') ensures thresholds are based on total activity rather than averages.
Once you've established these dynamic baselines, the next step is to focus on minimizing unnecessary alerts.
Avoiding False Positives and Alert Fatigue
Reducing transient noise is key to avoiding false positives. Functions like movingAverage() or summarize() can aggregate data over a 5–10 minute window, smoothing out short-lived spikes. Since Hosted Graphite typically collects data at 30-second intervals, these aggregates naturally reduce sensitivity to brief fluctuations.
To prevent "alert flapping" (constant notifications when a metric hovers near a threshold), set separate triggers and clear thresholds - this concept is known as hysteresis. For example, you might configure an alert to trigger at 80% CPU usage but clear it only when usage falls below 70%. This buffer ensures stability in notifications.
You can also configure alerts to trigger only on state changes, so notifications are sent only when a condition first arises or resolves. Additionally, scheduling mutes during known maintenance windows or predictable high-load periods, like nightly batch jobs, can further reduce unnecessary alerts.
| Threshold Strategy | When to Apply | Primary Benefit |
|---|---|---|
| 5-95 Span | Response times, latency | Filters out extreme outliers to better reflect user experience |
| Holt-Winters | Seasonal traffic patterns | Adjusts dynamically to expected fluctuations |
| Hysteresis | Metrics near threshold limits | Avoids repeated alerts by requiring distinct trigger and clear values |
| Data Smoothing | Noisy infrastructure metrics | Reduces false positives caused by transient spikes |
Integrating Graphite Alerts with MetricFire Notifications
Once you've set up your alert thresholds, the next step is to integrate notifications through MetricFire. This completes your alerting workflow by routing alerts to the right recipients via preferred channels. MetricFire’s alerting system for Hosted Graphite is designed to trigger alerts as soon as data is ingested, not when it’s rendered. This means faster response times when dealing with alert queries. As MetricFire explains:
"Our alerts trigger off of values upon ingestion, rather than upon render resulting in faster response times to alert queries."
Here’s how it works: first, create a notification channel in the MetricFire Notification Channel Page, and then assign it to specific alerts. A bonus? MetricFire includes 1,000 free alerts with all plans above the Basic tier.
Supported Notification Channels
MetricFire supports seven key notification channels, each requiring specific setup details. To add a channel, go to the Notification Channel Page in the Hosted Graphite interface, click "+ Add Channel", pick your service, enter the necessary credentials, and save. Afterwards, manually link the channel to your alerts. These channels ensure your team gets timely updates and can respond quickly.
| Notification Channel | Required Configuration Info | Key Use Case |
|---|---|---|
| One or more email addresses | Standard team notifications | |
| Slack | Webhook URL | Real-time chat alerts for instant action |
| PagerDuty | Service or Integration Key | Incident management and on-call paging |
| Microsoft Teams | Teams Webhook URL | Alerts for enterprise collaboration tools |
| Webhook | Destination URL | Custom integrations and automated workflows |
| OpsGenie | API Key | Incident response and orchestration |
| VictorOps | Escalation Webhook | Infrastructure monitoring and alerting |
For Slack alerts, remove double quotation marks from descriptions to avoid JSON parsing issues. For PagerDuty, grab your Service or Integration Key from the PagerDuty dashboard to link it properly. Webhook notifications use a standard JSON format that includes details such as the alert name, criteria, a graph image, the current metric value, and the status.
Best Practices for Notification Configuration
To avoid drowning in alerts, it’s important to control how and when notifications are sent. MetricFire offers two notification modes: "On state change", which triggers alerts only when the system transitions between healthy and triggered states, and "Every X minutes", which sends alerts at fixed intervals. For most cases, "On state change" is a better option as it reduces repetitive notifications while keeping you informed of both issues and their resolutions.
During planned maintenance or expected high activity periods, you can schedule mutes to suppress notifications. This is especially useful for things like nightly batch jobs or weekend deployments that might otherwise flood your inbox.
For more complex scenarios, leverage Composite Alerts via the API. This feature lets you combine up to four criteria using AND/OR logic, simplifying notifications for related issues. For example, you might group high CPU usage and increased response times into one alert. To make these alerts even more actionable, include links to relevant dashboards and runbooks in the "Alert Info" field. This ensures responders can address issues quickly without needing extensive system knowledge.
Conclusion and Key Takeaways
Setting up effective alert thresholds in Graphite isn’t just about picking numbers - it’s about creating a monitoring system that keeps your infrastructure safe without drowning your team in noise. The focus should always be on symptom-based alerting that highlights user-facing issues such as latency, errors, and availability, rather than on internal metrics that add unnecessary clutter. As the Grafana documentation wisely states:
"If no action is possible, it shouldn't be an alert - consider using a dashboard instead".
Start by defining and differentiating your severity thresholds. Use Warning thresholds for issues that can wait until regular business hours and reserve Critical thresholds for events that demand immediate attention. For metrics that follow seasonal trends, statistical tools like Holt-Winters are better at spotting genuine anomalies compared to static thresholds.
To combat alert fatigue, implement strategies like delay periods to avoid flapping alerts, hysteresis to reduce repeated triggers near threshold boundaries, and composite notifications to group related alerts. Setting notifications to "On state change" ensures you capture both issues and their resolutions without bombarding your team with redundant alerts.
Think of your alerts as living documentation. Regularly review and adjust them - quarterly reviews are a good practice - to fine-tune thresholds that fire too often or to eliminate alerts that don’t drive meaningful action. Each alert should provide clear context, links to runbooks, and access to dashboards, enabling responders to act swiftly without needing deep technical knowledge.
FAQs
How do I reduce false positives when setting alert thresholds in Graphite?
To cut down on false positives in Graphite alerts, it's crucial to align thresholds with the usual behavior of your metrics. Start by digging into historical data to uncover typical patterns and variations. Use this information to set thresholds that accommodate these natural fluctuations. Steer clear of thresholds that are too rigid, as they can lead to alerts for predictable, routine changes.
Consider incorporating techniques like anomaly detection or statistical analysis to help distinguish between actual problems and normal activity. Make it a habit to periodically review and tweak your thresholds to match any changes in your system. This approach ensures your alerts remain meaningful and actionable. With these adjustments, you’ll minimize unnecessary notifications and enhance the reliability of your monitoring.
What are the advantages of using dynamic thresholds in Graphite for monitoring?
Dynamic thresholds in Graphite offer a smarter way to monitor your metrics by adjusting automatically to their behavior. Unlike static thresholds, which stay constant and might trigger unnecessary alerts during normal variations, dynamic thresholds adapt in real-time. This helps cut down on false positives and ensures that alerts flag actual problems.
These thresholds are particularly helpful in systems with fluctuating workloads or metrics that naturally evolve, like response times or CPU usage. By aligning alerts with the real-time state of your system, dynamic thresholds make it easier to catch genuine anomalies, improve system reliability, and reduce alert fatigue for your team. The result? More meaningful notifications and better use of resources when resolving issues.
How can I set up Slack notifications for Graphite alerts?
To connect Graphite alerts to Slack, you’ll first need to set up a Slack notification channel within Hosted Graphite. Begin by creating a Slack app in your workspace and enabling incoming webhooks. This will provide you with a webhook URL. Next, head to Hosted Graphite and use that URL to configure a new notification channel. Link this channel to your alert rules, and you’re good to go! From then on, alerts will automatically show up in your Slack channel. To keep things running smoothly, make sure your thresholds and alert rules are carefully adjusted to minimize unnecessary notifications.
Sign up for the free trial and begin monitoring your infrastructure today. You can also book a demo and talk to the MetricFire team directly about your monitoring needs.

