
Table of Contents
Great systems are not just built. They are monitored.
MetricFire runs Graphite and Grafana as a fully managed service for growing engineering teams, taking care of storage, scaling, and version updates so your team doesn't have to. Plans start at $19/month, billed per metric namespace rather than per host, and include engineer-staffed support. Integrations work natively with Heroku, AWS, Azure, and GCP, and data is stored with 3× redundancy in SOC2- and ISO:27001-certified data centres.
Introduction
InfluxDB is a widely used time-series database designed for storing and querying metrics, events, and telemetry data. It’s commonly used for infrastructure monitoring, application instrumentation, and IoT-style workloads where time-based data is central. In many environments, InfluxDB already exists as part of the monitoring or data collection pipeline, and the primary need is simply to visualize that data effectively.
This guide focuses on connecting an existing InfluxDB instance directly to Grafana. We’ll cover installing InfluxDB on an Ubuntu server, optionally collecting basic system metrics with Telegraf, and configuring InfluxDB as a Grafana datasource using Flux. By the end, you’ll have live, queryable time-series data displayed in Grafana without needing to forward, duplicate, or transform metrics. This approach works well for testing, learning Flux, and environments where InfluxDB is already the system of record for metrics.
Step 1: Install and Configure InfluxDB (ubuntu)
This article assumes that you are already running an instance of InfluxDB, but below is a step by step guide to get up and running quickly, if you want to follow along for testing purposes. InfluxDB isn’t included in Ubuntu’s default repositories, so the first step is adding its official APT repository. Once that’s done, InfluxDB installs and updates like any other system package.
Add an InfluxData signing key:
curl -fsSL https://repos.influxdata.com/influxdata-archive.key \
  | sudo gpg --dearmor -o /usr/share/keyrings/influxdb.gpg
Add the InfluxData repository:
echo "deb [signed-by=/usr/share/keyrings/influxdb.gpg] \
https://repos.influxdata.com/ubuntu $(lsb_release -cs) stable" \
| sudo tee /etc/apt/sources.list.d/influxdb.list
Install InfluxDB:
sudo apt update
sudo apt install influxdb2 -y
Start and enable the service:
sudo systemctl enable --now influxdb
sudo systemctl status influxdb
Allow Browser and Grafana Access
InfluxDB listens on port 8086 by default, should be fully accessible externally, and is ready to be added as a Grafana datasource. However, you may have to update your firewall rules to allow easy access:
sudo ufw allow 8086/tcp
sudo ufw reload
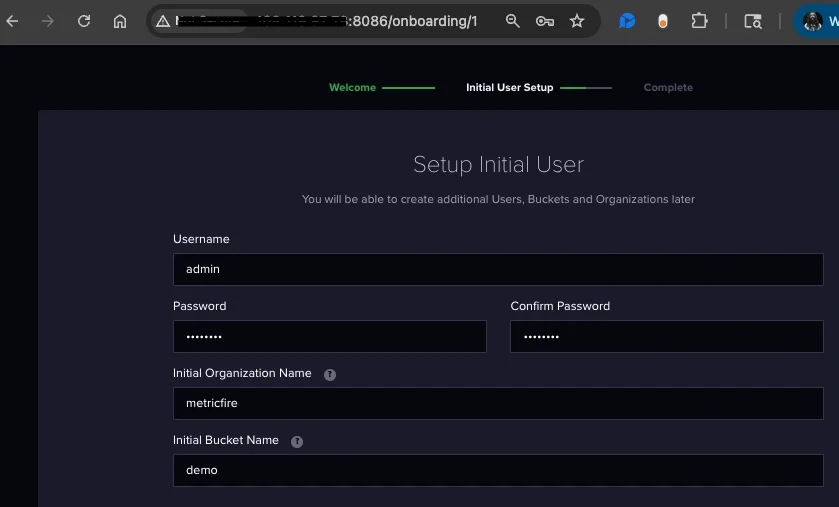
You can now access the InfluxDB UI in your browser at: http://<server-ip>:8086
When you first open the InfluxDB UI, you’ll be prompted to complete a one-time setup. This creates authentication and defines where your data will live. InfluxDB will generate an API token during setup. Save this token because it’s required for Grafana, and this is all the authentication you will need for this guide. We have also named our initial bucket demo, which is the bucket name that will be called throughout this guide.
Step 2 (optional): Configure Telegraf to Collect System Metrics
If you want an easy way to forward system metrics to your new InfluxDB account, Telegraf is probably the easiest way to accomplish that. If you don't already have an instance of Telegraf running on your server, you can install our handy HG-CLI tool to quickly install/configure Telegraf:
curl -s "https://www.hostedgraphite.com/scripts/hg-cli/installer/" | sudo sh
NOTE: You will need to input your Hosted Graphite API key and follow the prompts to select which metric sets you want.
Once it's installed, open the Telegraf configuration file at: /etc/telegraf/telegraf.conf and add the following section to configure the InfluxDB output plugin:
[[outputs.influxdb_v2]]
  urls = ["http://localhost:8086"]
  token = "YOUR_API_TOKEN"
  organization = "YOUR_ORG"
  bucket = "BUCKET_NAME"
Now just save your updated conf file, and restart the Telegraf service. Or you can run Telegraf manually to inspect the output for potential syntax/permission errors:
telegraf --config /etc/telegraf/telegraf.conf
Telegraf will now continuously write system metrics into InfluxDB account, and the Hosted Graphite backend.
Step 3: Connect InfluxDB to Hosted Grafana
In your Grafana account:
- Navigate to Connections => Connect Data
- Search/select: InfluxDB
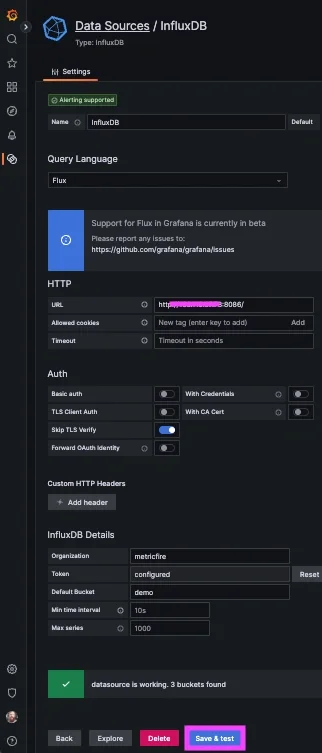
- Query Language: Flux
- URL: http://<server-ip>:8086
- (for testing) Skip TLS Verify: enable
- Organization: ORG_NAME
- Token: YOUR_INFLUXDB_TOKEN
- Default Bucket: BUCKET_NAME
- Save & Test
If you don't already have a running instance of Grafana, you can get one for FREE when you start a 14-day trial with MetricFire!
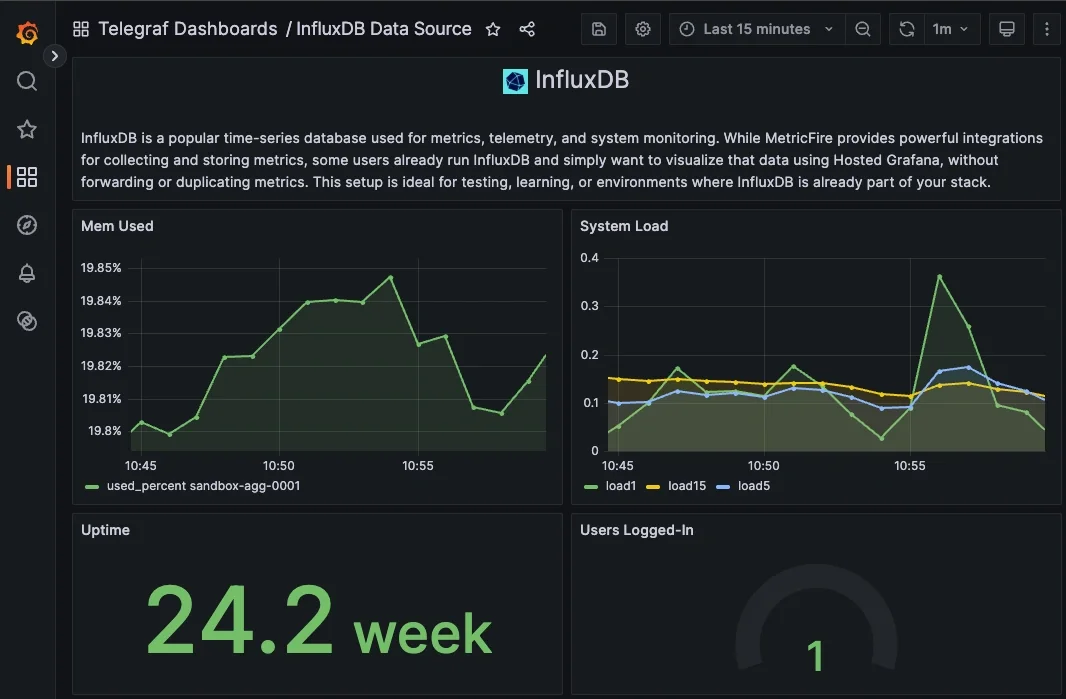
Step 4: Visualize System Metrics
Create a Grafana Dashboard Panel
In your Grafana:
- Navigate to => Dashboards => New Dashboard => "Add new panel"
- Select your new InfluxDB Datasource and select the Code option
Add Flux Queries
For visualizations in Grafana we are using the Flux query language, and here are a few useful starter queries:
Memory Used
from(bucket: "demo")
  |> range(start: -30m)
  |> filter(fn: (r) => r._measurement == "mem")
  |> filter(fn: (r) => r._field == "used_percent")
  |> aggregateWindow(every: 1m, fn: mean, createEmpty: false)
  |> yield(name: "Memory Used (%)")
System Load
from(bucket: "demo")
  |> range(start: -30m)
  |> filter(fn: (r) => r._measurement == "system")
  |> filter(fn: (r) => r._field == "load1" or r._field == "load5" or r._field == "load15")
  |> drop(columns: ["host"])
  |> aggregateWindow(every: 1m, fn: mean, createEmpty: false)
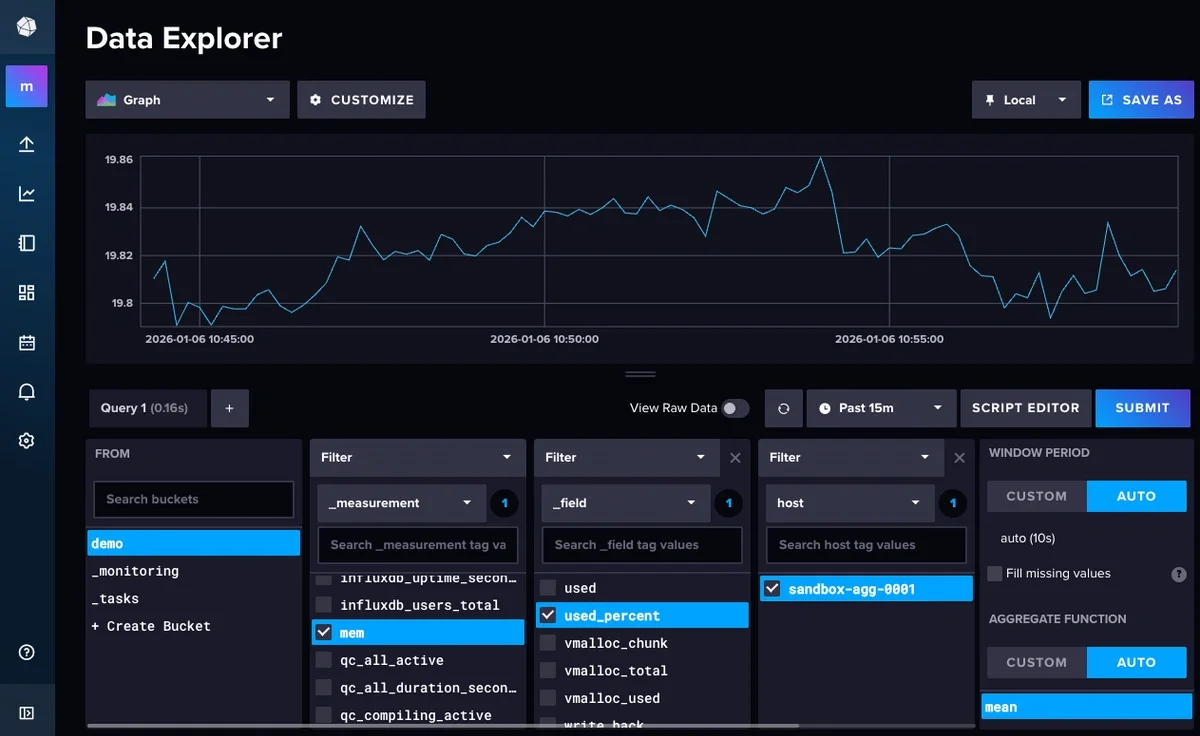
You can also visualize the same metrics in the InfluxDB browser UI, but Grafana is generally better looking and easier to work with:
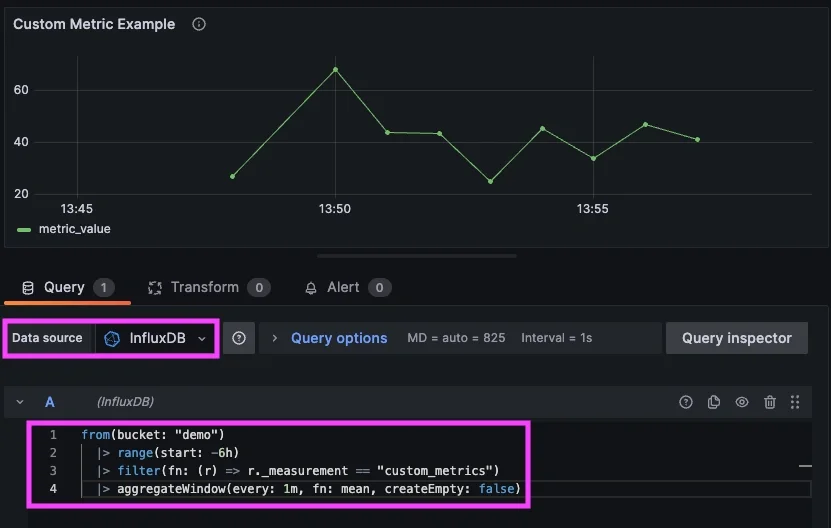
Step 5 (optional): Custom Metric Example
InfluxDB isn’t limited to agent-collected system metrics. Any process capable of making an HTTP request can write time-series data directly to a bucket. This makes InfluxDB useful for scripts, scheduled jobs, batch processes, and other custom metric sources where deploying an agent may not be necessary. To demonstrate this, we’ll write a small set of synthetic metrics directly to InfluxDB and visualize them in Grafana.
Insert Custom Metrics
for i in $(seq 1 15); do
  curl -X POST "http://localhost:8086/api/v2/write?org=metricfire&bucket=demo&precision=s" \
    -H "Authorization: Token YOUR_TOKEN" \
    --data-raw "custom_metrics metric_value=$((RANDOM % 100))"
  sleep 1
done
Query in Grafana
from(bucket: "demo")
  |> range(start: -30m)
  |> filter(fn: (r) => r._measurement == "custom_metrics")
  |> aggregateWindow(every: 1m, fn: mean, createEmpty: false)
Conclusion
InfluxDB and Grafana are designed to work well together, and connecting InfluxDB directly as a Grafana datasource is often the most straightforward way to visualize time-series data that already exists. Once InfluxDB is running and accessible, Grafana can query data immediately using Flux, making it easy to explore metrics, build dashboards, and iterate on visualizations without changing how data is collected.
This type of flexibility makes the setup suitable for a wide range of use cases, from local testing and development environments to production systems where InfluxDB is already in place. By keeping the configuration simple and focused, this approach provides a clean, maintainable way to visualize InfluxDB data alongside other Grafana-supported datasources.
Sign up for the free trial and begin monitoring your infrastructure today. You can also book a demo and talk to the MetricFire team directly about your monitoring needs.


