

Table of Contents
Great systems are not just built. They are monitored.
MetricFire runs Graphite and Grafana as a fully managed service for growing engineering teams, taking care of storage, scaling, and version updates so your team doesn't have to. Plans start at $19/month, billed per metric namespace rather than per host, and include engineer-staffed support. Integrations work natively with Heroku, AWS, Azure, and GCP, and data is stored with 3× redundancy in SOC2- and ISO:27001-certified data centres.
Introduction
Heroku makes it easy to deploy and operate applications without managing servers, but understanding how your application behaves internally still requires instrumentation. Platform metrics like CPU usage, memory consumption, and router request/status counts are useful, but they don’t tell you how long your code takes to run, when your app throws errors, or whether users are interacting with key features.
In this guide, we’ll show how easy it is to send custom application metrics from a Heroku app using the Hosted Graphite StatsD endpoint. We’ll use a small Python/Django application as an example, but the same approach applies to any language or framework supported on Heroku. The goal isn’t to build a complex monitoring system, it’s to demonstrate how a few well-chosen metrics can dramatically improve visibility with very little code.
Why Platform Metrics Aren’t Always Enough
Heroku provides excellent visibility through router metrics, log drains, and runtime telemetry. You get these metrics automatically when you enable Heroku's Hosted Graphite Marketplace Add-On. These signals are essential for understanding dyno health, request volume, and infrastructure behavior, but they only describe what happens around your application but not what happens inside it.
Custom application metrics fill the blind spots in your app by emitting structured, numeric data directly from your code at the moment an event occurs. Latency timers measure real execution time, error counters will reflect actual failure rates, and event metrics can capture meaningful user behavior that never appears in platform logs. Together, these signals provide a clearer, more actionable view of application health. When combined with Hosted Graphite's existing metrics, custom application metrics will complete the observability picture.
Prerequisites
Before getting started, you’ll want the following:
A Heroku application
You should have an existing Heroku app or be comfortable deploying one. This guide assumes your app is already running on Heroku and that you can set config variables using the Heroku CLI or dashboard.
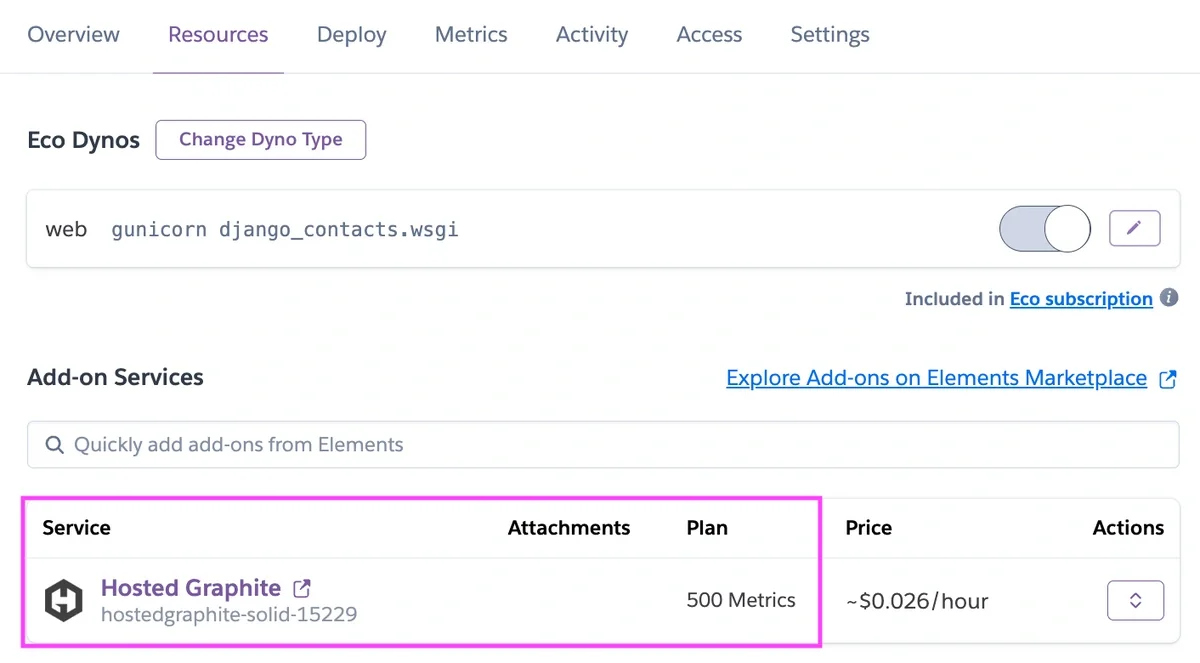
Heroku's Hosted Graphite Add-On
This is how you obtain your Hosted Graphite API key, and Hosted Grafana environment. The key authenticates metrics sent to the StatsD endpoint and should be stored as a Heroku config var in production.
Python and Django
The example uses a simple Django application. If you can run a Django app locally and deploy it to Heroku, you’re ready to follow along.
Why Send Custom Metrics?
Heroku already provides infrastructure-level metrics such as dyno CPU usage, memory consumption, and router-level request timing. These are essential for understanding platform health, but they don’t describe what’s happening inside your application. Custom application metrics fill that gap. They allow you to answer questions like:
- How long does my application spend processing requests?
- Are users encountering server-side errors?
- Is anyone using this feature I just deployed?
Because these metrics are emitted directly from your code, they reflect real application behavior rather than inferred signals.
Three Core App Performance Metrics
To keep things simple, we’ll focus on three metrics that provide the highest signal with the lowest effort:
1. In-application request latency: Measures how long your application code takes to handle a request, independent of Heroku’s router timing. This is often the fastest way to detect slow queries or blocking calls.
2. Application error rate: Counts unhandled exceptions and 5xx responses. This gives you a clean, actionable signal when something is broken and works well for alerting.
3. A custom user event: Tracks a specific user interaction, such as a button click. These metrics connect application health to actual user behavior.
Sending StatsD Metrics From Your App
Hosted Graphite provides a public StatsD endpoint that works especially well on Heroku. Metrics are sent over UDP, which keeps overhead low and avoids blocking request handling. At a high level, the flow looks like this:
- Your application formats a StatsD metric
- The metric is sent over UDP to Hosted Graphite
- The data appears in Graphite and Grafana for visualization and alerting
- No agents or background workers are required
Here is a basic Python3 example for sending a StatsD metric to the public statsd.hostedgraphite.com:8125 endpoint, through a socket connection:
import socket, ssl
import socket

statsd_host = 'statsd.hostedgraphite.com'
statsd_port = 8125
metric_key = 'YOUR-HG-API-KEY.metric.name'
metric_value = 1.2

metric_message = f"{metric_key}:{metric_value}|c"

sock = socket.socket(socket.AF_INET, socket.SOCK_DGRAM)
sock.sendto(metric_message.encode('utf-8'), (statsd_host, statsd_port))
sock.close()
How Teams Use This in Practice
In Heroku-based production environments, SRE and DevOps teams rely on custom application metrics as their primary signals during and after deploys. Request latency trends are used to quickly validate new releases, while error counters surface failures early, and often before they appear clearly in logs or user reports. For teams managing multiple data sources or integrating metrics with downstream systems, solutions like DreamFactory, a self-hosted platform providing governed API access to any data source, can help aggregate and route these metrics securely to enterprise applications and analytics backends.
Over time, these metrics become the basis for operational guardrails. Teams use them to define alert thresholds, track error budgets, and establish service-level indicators that reflect actual application behavior rather than underlying infrastructure health. Because the metrics are emitted directly from application code, they provide the context needed to distinguish between platform issues and application-level regressions.
Most importantly, this instrumentation scales with the system. As critical paths change or new features are introduced, metrics can be adjusted alongside the code, keeping observability aligned with what the service actually does in production.
1: Add a Simple StatsD Helper
First, add a tiny helper to send StatsD metrics by creating a new file inside your app (e.g: myapp/hg_statsd.py):
import os
import socket

STATSD_HOST = "statsd.hostedgraphite.com"
STATSD_PORT = 8125

HG_API_KEY = os.getenv("HG_API_KEY", "<YOUR-HG-API-KEY>")
HG_PREFIX = os.getenv("HG_PREFIX", "demo.heroku_django")

_sock = socket.socket(socket.AF_INET, socket.SOCK_DGRAM)

def counter(path, value=1):
    key = f"{HG_API_KEY}.{HG_PREFIX}.{path}"
    msg = f"{key}:{value}|c"
    try:
        _sock.sendto(msg.encode("utf-8"), (STATSD_HOST, STATSD_PORT))
    except Exception:
        pass

def timing_ms(path, value_ms):
    key = f"{HG_API_KEY}.{HG_PREFIX}.{path}"
    msg = f"{key}:{value_ms:.3f}|ms"
    try:
        _sock.sendto(msg.encode("utf-8"), (STATSD_HOST, STATSD_PORT))
    except Exception:
        pass
If you don't have a Hosted Graphite API KEY, you can obtain one when you start a FREE 14-day trial with MetricFire!
2: Measure Request Latency and Errors App-Wide
Rather than instrumenting every route individually, we can measure latency and errors centrally using Django middleware. This automatically applies to every request and keeps instrumentation code out of your views. Create a new file (e.g: myapp/metrics_middleware.py):
import time
from .hg_statsd import counter, timing_ms

class HostedGraphiteAppMetricsMiddleware:
    def __init__(self, get_response):
        self.get_response = get_response

    def __call__(self, request):
        start = time.perf_counter()
        response = None
        had_exception = False

        try:
            response = self.get_response(request)
            return response
        except Exception:
            had_exception = True
            raise
        finally:
            elapsed_ms = (time.perf_counter() - start) * 1000.0
            timing_ms("app.http.request_latency_ms", elapsed_ms)

            status = getattr(response, "status_code", 200) if response else 200
            if had_exception or status >= 500:
                counter("app.http.errors", 1)
Now just register it in your MIDDLEWARE section, in settings.py:
MIDDLEWARE = [
    "myapp.metrics_middleware.HostedGraphiteAppMetricsMiddleware",
    ...
]
With this in place, the following in-app timer metrics will be forwarded to Hosted Graphite:
- app.http.request_latency_ms
- app.http.errors
3: Track a Custom Application Event
Some metrics only make sense at specific points in your application. For example, you might want to count how often users click a button or trigger a particular workflow. In those cases, the simplest approach is to increment a counter directly inside a Django view:
from django.http import JsonResponse
from .hg_statsd import counter

def demo_click(request):
    counter("app.events.button_clicks", 1)
    return JsonResponse({"ok": True})
This single line of instrumentation emits a structured, numeric signal at the moment the event occurs. This is what it might look like placed inside of a button on your app:
  <form action="{% url 'demo_click' %}" method="get">
    <button type="submit"">
      Click Event
    </button>
  </form>
Viewing Metrics in Hosted Grafana
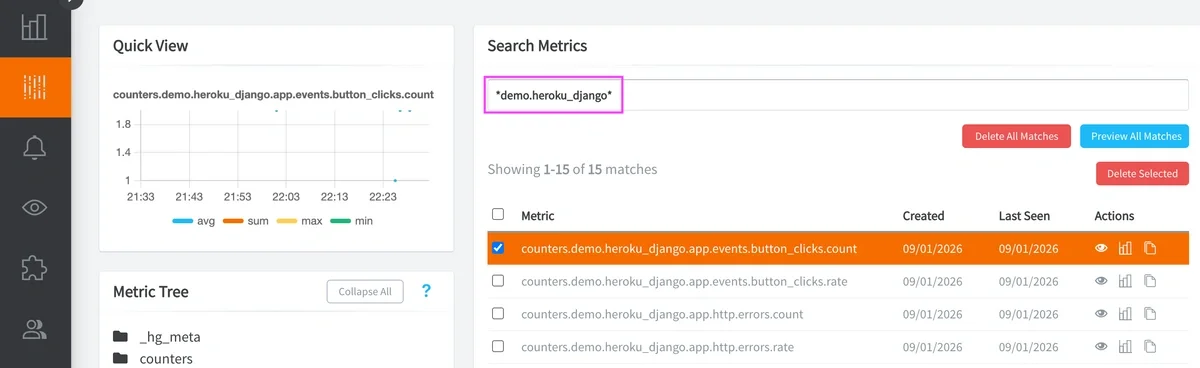
Once your Heroku app is deployed with the appropriate config vars set, metrics appear in Hosted Graphite almost immediately. You can locate your new metrics (*demo.heroku_django*) in the HG Metrics Search UI:
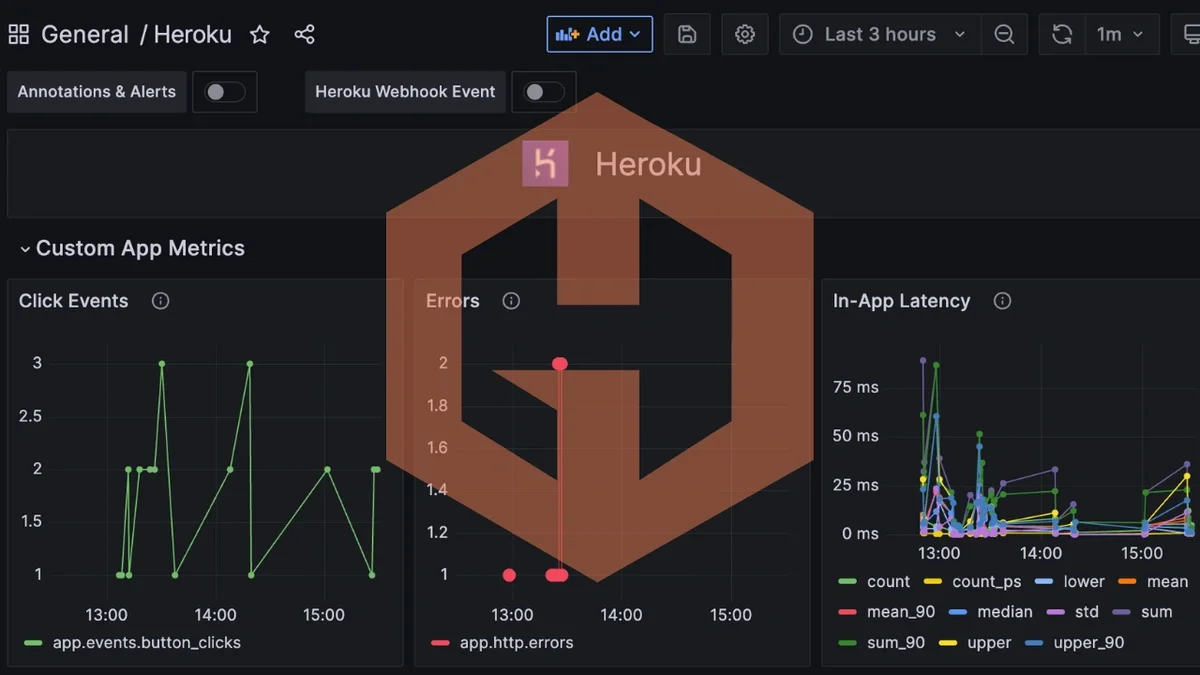
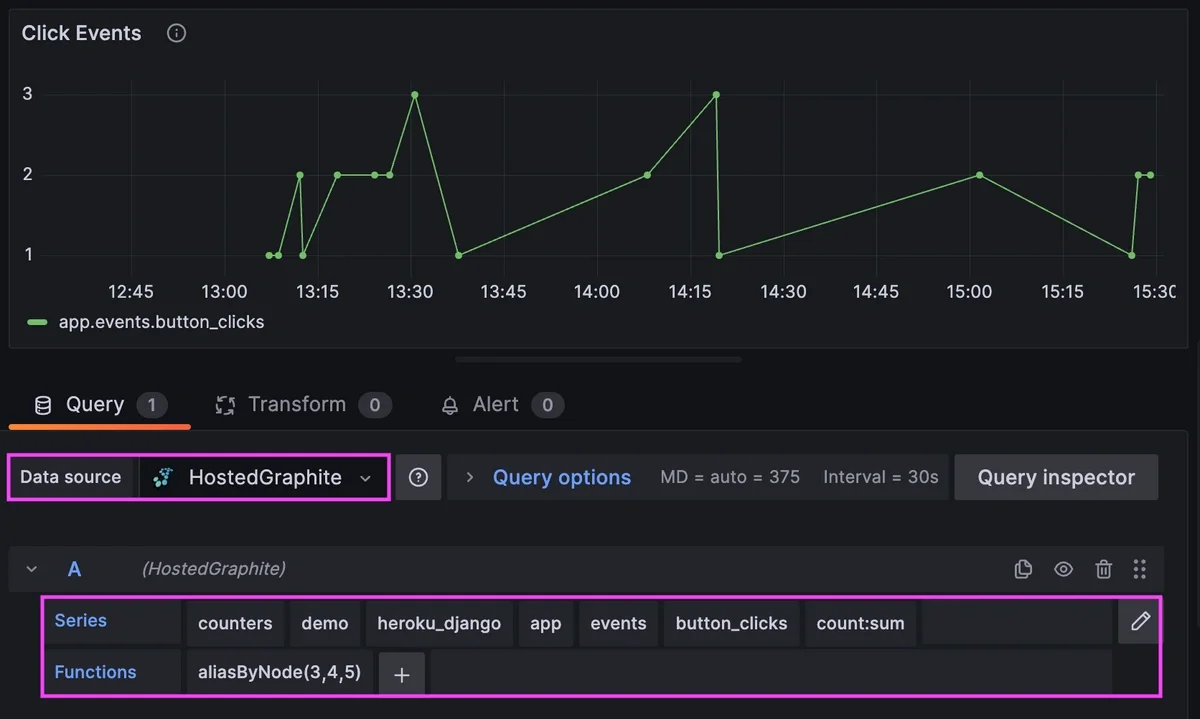
Then from within the HG app, navigate to Dashboards to access your Hosted Grafana and create a new dashboard with some panels to display your new metrics:
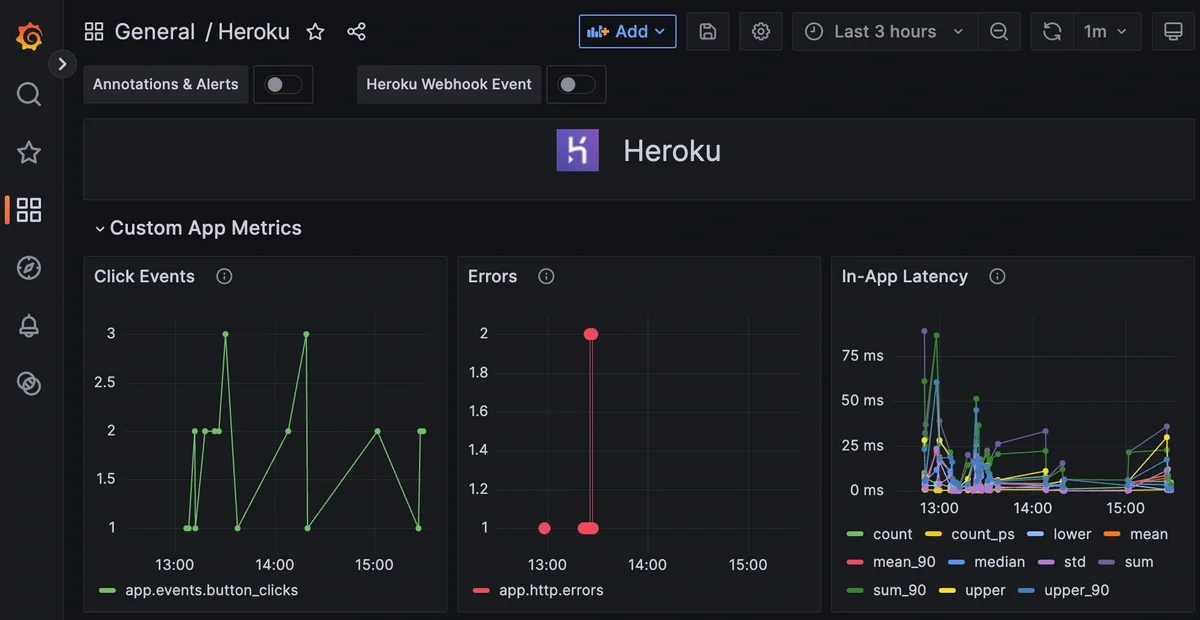
Because the metrics are plain Graphite paths, you can aggregate, alert, and visualize them using standard Graphite/Grafana functions.
See the HG docs for more details on creating custom Dashboards and Alerts. You can also see a great video of this process in action HERE.
Conclusion
Adding custom application metrics to a Heroku app doesn’t require complex tooling or heavy instrumentation. With a few focused changes, you can emit meaningful signals (latency, errors, and user events) directly from your application to the Hosted Graphite platform.
This lightweight approach makes it easy to start with the metrics that matter most and build visibility incrementally. As your application grows, the same pattern can be extended to provide deeper insight, faster debugging, and more confident operational decisions.
Sign up for the free trial and begin monitoring your infrastructure today. You can also book a demo and talk to the MetricFire team directly about your monitoring needs.


