
Table of Contents
- Introduction
- Key Takeaways
- Introduction to Redis
- Redis Performance Monitoring Options
- Introduction to Prometheus
- How does Prometheus work
- Setting up Redis for Monitoring
- Setting up Prometheus to send data
- Plotting the visualization on Hosted Grafana
- List of Metrics exposed by Redis Exporter
- Conclusion
Introduction
In this article, we are going to look at how to monitor Redis's performance using Prometheus. This will allow Redis Administrators to centrally manage all of their Redis clusters without setting up any additional infrastructure for monitoring.
To follow the steps in this blog, sign up for the MetricFire free trial, where you can use Graphite and Grafana directly on our platform. MetricFire is a hosted Graphite and Grafana service, where we do the setup and management of these open-source tools so you don’t have to.
Key Takeaways
- Redis is a popular in-memory database used for various purposes such as a database, message broker, and cache, supporting various data structures and replication.
- Redis performance monitoring is crucial for Redis administrators, and there are multiple options available, including Redis Enterprise built-in monitoring, REST APIs (for Redis Enterprise users), and Prometheus Metrics Exporter.
- Setting up Redis Exporter can be done as a Docker container, standalone executable, or Linux SystemD service, with the latter recommended for production deployments.
- Prometheus is configured to scrape metrics from Redis Exporter and store them in its time series database at regular intervals.
- Redis Exporter exposes a wide range of metrics, including metrics related to memory usage, replication, connections, CPU usage, and more.
Introduction to Redis
Redis is one of the most popular in-memory databases. It is frequently used as a database, message broker, and cache. It supports various data structures such as lists, sets, and hashes along with string data types. It also comes out of the box with replication and a Least Recently Used (LRU) eviction scheme.
Redis Performance Monitoring Options
The official Redis blog gives some options on how to monitor Redis instances:
- Redis Enterprise built-in monitoring capabilities - The Redis Enterprise cluster management UI is a good option. It gives the ability to visualize various metrics and as well as alerting mechanisms. However, keep in mind that Redis Enterprise built-in monitoring is only available for Enterprise users of Redis. For those using open-source Redis, this is not a viable option.
- REST API - Again, this option is only available for Redis Enterprise users where a set of REST APIs are exposed to make available the Redis metrics to be consumed by clients. Consuming the data from this API requires custom development.
- Prometheus Metrics Exporter - Using Prometheus metrics exporter is one of the other approaches for Redis monitoring. It is the best option given the wide adoption of Prometheus as a monitoring solution across enterprises. This option works best because we will customize this solution using Hosted Prometheus and Hosted Grafana to monitor any Redis instance, including the free open-source versions.
Introduction to Prometheus
Prometheus is an open-source monitoring solution originally developed by SoundCloud. Since then it has been adopted by many organizations as their monitoring and alerting solutions. One of the advantages of Prometheus is that it comes with support for almost all the systems we want to monitor such as databases, Operating systems, etc.
We have much more detailed information about Redis and Redis enterprise in our earlier article Monitoring Redis Clusters with Prometheus. Make sure to check that out.
In this article, we will be using Prometheus and visualizing the data in Grafana.
How does Prometheus work
Before we dive into Redis performance monitoring with Prometheus, it is important to understand a little about its architecture and how Prometheus works. Prometheus is designed to work with pluggable exporters. An exporter is basically a script or a service that will fetch metrics from the application being monitored and feed the data to Prometheus. The Prometheus integrations page gives the list of the most popular exporters for all third-party systems out there. For example, in this case, we are going to use a service called Redis Exporter. Redis exporter service gets the data from Redis and exposes it on the network port (9121 by default).
Once the Redis exporter exposes the Redis metrics, we instruct Prometheus to connect to this port, read the data, and store it in its time series database at regular intervals.
Setting up Redis for Monitoring
As mentioned above, we will be using Redis Exporter to scrape metrics from our Redis instance and feed them into our Prometheus instance.
Redis exporter can be run as a docker container, standalone executable, or as a Linux SystemD service. Running it as a standalone executable works for testing but is not a recommended solution for production deployments. If you are already running a container technology in products such as Docker or Kubernetes, then go for running it as a container, else running it as a Linux SystemD service is the best way.
For more information on how to run Redis Exporter on Docker, Kubernetes, or as a service, look at the Redis Exporter documentation.
Once the exporter is up and running, it's as simple as adding the below configuration in the prometheus.yml to start having Prometheus call the Redis exporter service and read the metrics.
scrape_configs:
  - job_name: redis_exporter
    static_configs:
    - targets: ['<<REDIS-EXPORTER-HOSTNAME>>:9121']
Here the <<REDIS-EXPORTER-HOSTNAME>> refers to the host where the Redis exporter is running. We could opt to run the Redis Exporter in the same instance as the Redis. Or, if we have multiple Redis instances, it's better to run Redis Exporter on its dedicated instance and have it expose metrics for each of the Redis instances.
In case of multiple Redis instances, the configuration needs to be tweaked as below:
scrape_configs:
  ## config for the multiple Redis targets that the exporter will scrape
  - job_name: 'redis_exporter_targets'
    static_configs:
      - targets:
        - redis://first-redis-host:6379
        - redis://second-redis-host:6379
        - redis://second-redis-host:6380
        - redis://second-redis-host:6381
    metrics_path: /scrape
    relabel_configs:
      - source_labels: [__address__]
        target_label: __param_target
      - source_labels: [__param_target]
        target_label: instance
      - target_label: __address__
        replacement: <<REDIS-EXPORTER-HOSTNAME>>:9121

  ## config for scraping the exporter itself
  - job_name: 'redis_exporter'
    static_configs:
      - targets:
        - <<REDIS-EXPORTER-HOSTNAME>>:9121
The hostnames listed under targets point to different Redis instances which we would want to monitor.
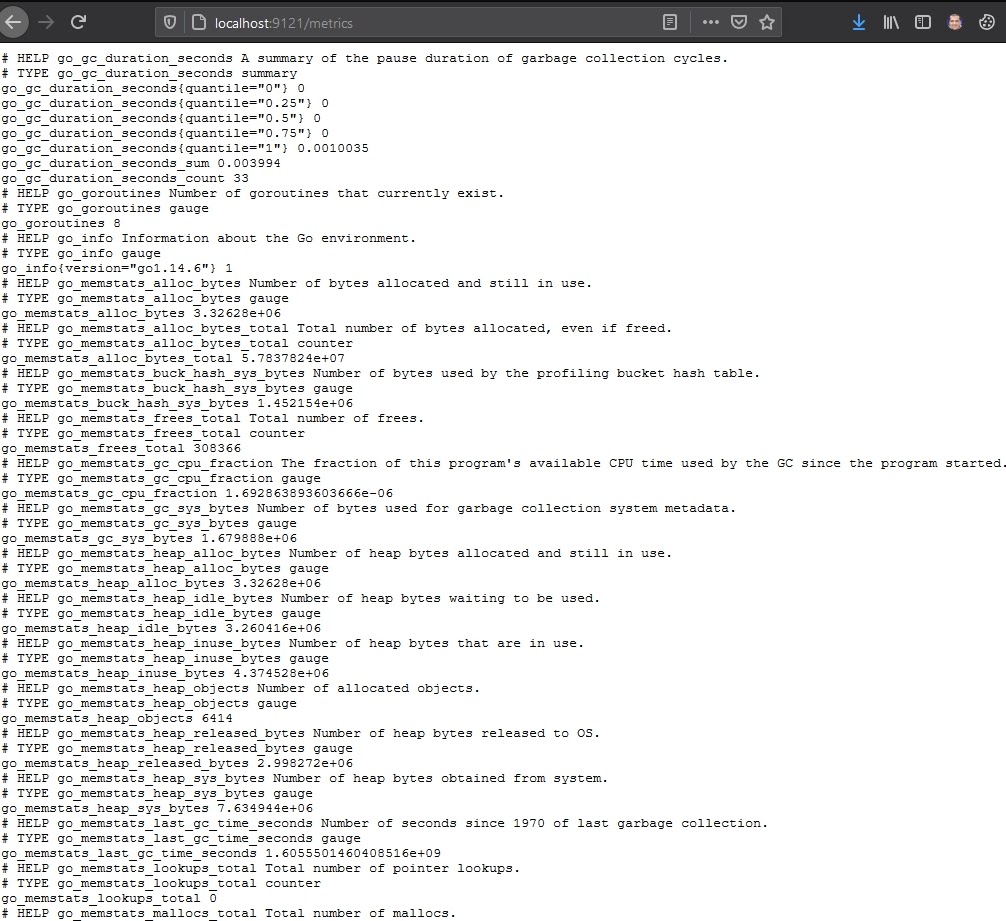
Once everything is set up, we can make sure Redis Exporter is successfully getting the metrics from Redis by browsing http://localhost:9121/metrics. We should see an output similar to below:
Setting up Prometheus to send data
We will be using Prometheus as a long-term data storage for our metrics. In order to send data to Prometheus, add new remote_write and remote_read sections like this:
remote_write:
  - url: https://prod.promlts.metricfire.com/write
    bearer_token: Your-API-key-goes-here
remote_read:
  - url: https://prod.promlts.metricfire.com/read
    bearer_token: Your-API-key-goes-here
In order to fetch your API key, browser to Hosted Graphite -> Addons -> Prometheus page. The page will give you your secure API key which will be used to send metrics from local Prometheus.
Plotting the visualization on Hosted Grafana
Now since our Prometheus is receiving the metrics from Redis, it's time to visualize it. We will make use of Hosted Grafana which is built on top of the industry-leading visualizing platform, Grafana. Grafana comes with a lot of visualization options such as graphs, gauges, and single metrics as well as alerting capabilities on top of those metrics.
Hosted Grafana already has an integration with Hosted Prometheus, so creating a visualization is as simple as importing the pre-built Redis Grafana dashboard.
So, let’s log in to Hosted Graphite at https://www.hostedgraphite.com/app and browse to Dashboards -> Grafana to open the Hosted Grafana application page.
We will use the Redis Dashboard for Prometheus Redis Exporter 1.x available from the Grafana Dashboard site itself.
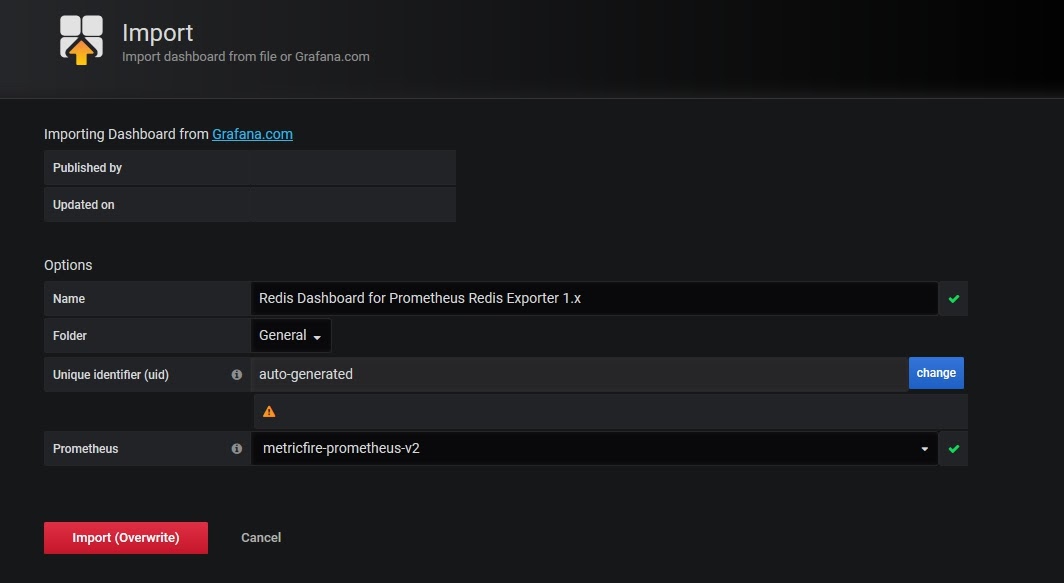
Download the dashboard from the “Download JSON” link and import it into Hosted Grafana through the import option. Make sure to choose the Prometheus data source as “metricfire-prometheus-v2” as shown below:
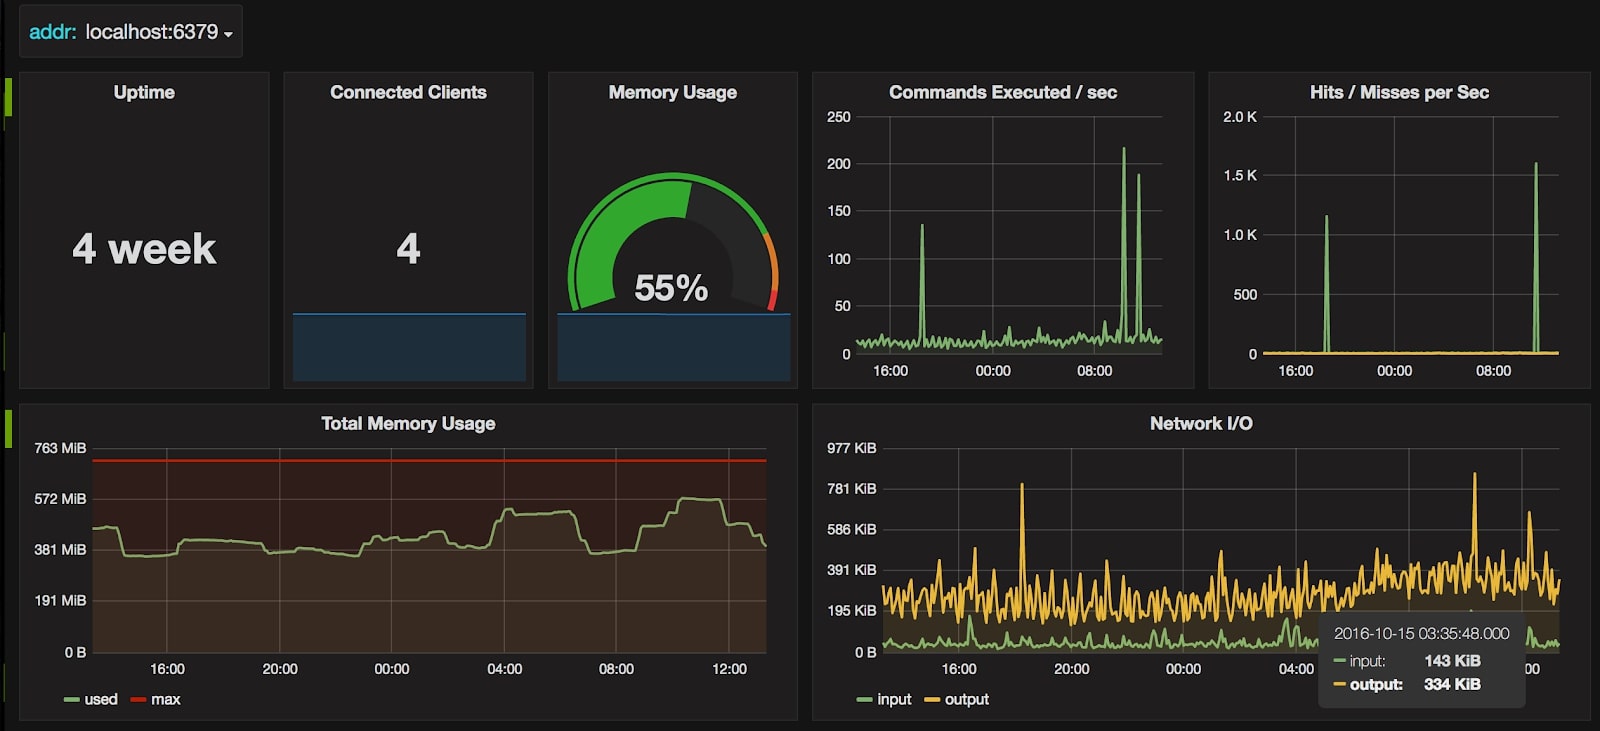
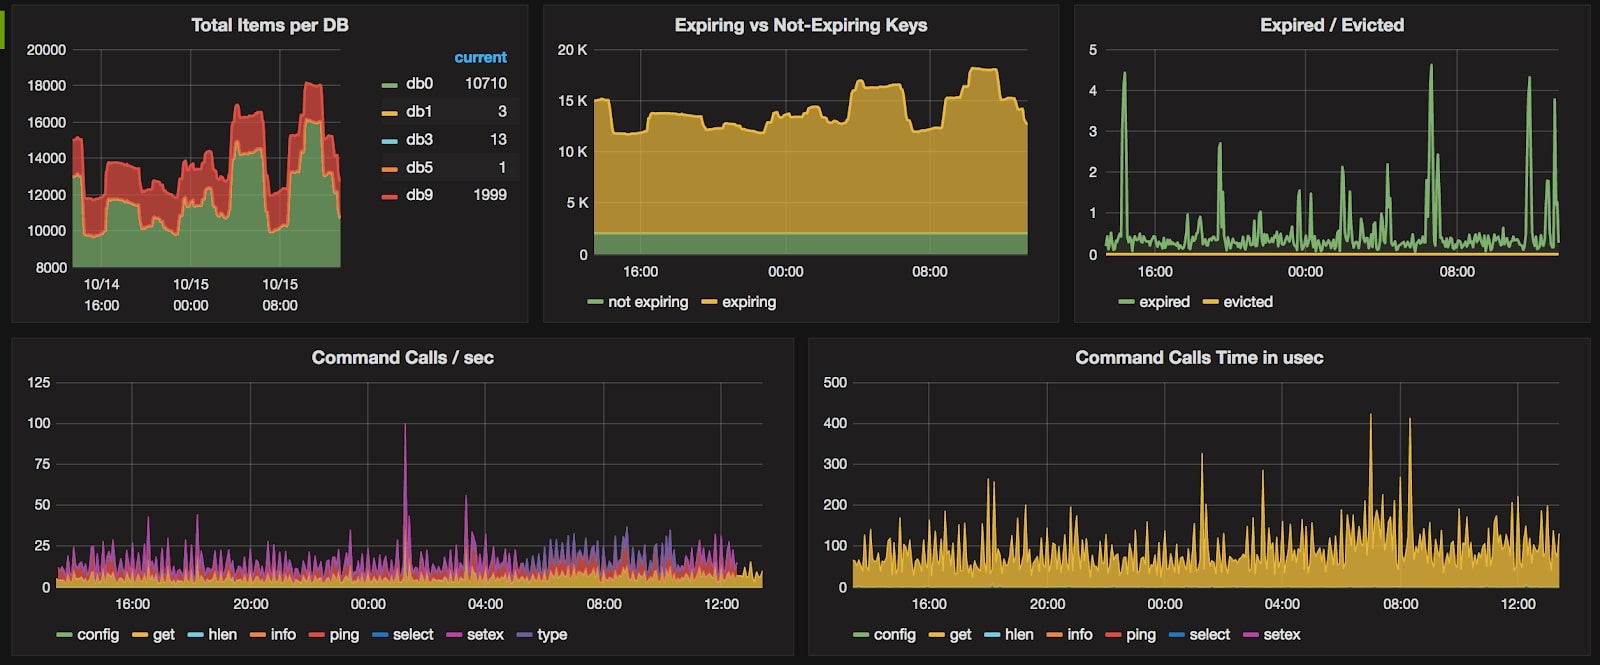
Once imported, We will be able to see the metrics visualized as shown below.
Hosted Grafana is a very powerful visualization tool built over Grafana. It allows you to create your own visualizations as well as set up alerts whenever a metric value crosses a certain threshold.
Check out our article Grafana Dashboards from Basic to Advanced to learn how to set up Grafana alerts, and build custom dashboards.
You can also create other types of visualizations based on the metrics exposed by Kubernetes. Have a look at the article Our Favorite Grafana Dashboards to create some of the more advanced dashboards.
List of Metrics exposed by Redis Exporter
Redis exporter is very comprehensive and exposes a lot of metrics from Redis. Here is the list of some of the key metrics:
- Uptime in seconds
- Process id
- Connected clients
- Blocked Clients
- Tracking Clients
- Client Recent Max Output Buffer
- Client Recent Max Input Buffer
- Allocator Active Bytes
- Allocated Allocated Bytes
- Allocator Resident Bytes
- Allocator Frag Ratio
- Allocator Frag Bytes
- Allocator RSS Ratio
- Allocator RSS Bytes
- Used Memory
- Used Memory RSS
- Used Memory Peak
- Used Memory LUA
- Used Memory overhead
- Used Memory startup
- Used Memory Dataset
- Used Memory Scripts
- Max Memory
- Max memory reservation
- Max Memory desired reservation
- Memory Fragmentation Ratio
- Memory Fragmentation Bytes
- Memory client Slaves
- Memory client Normal
- Lazy Free Pending Objects
- Active defrag Running
- Migrate cached sockets
- Active defrag hits
- Active defrag misses
- Active defrag key hits
- Active defrag key misses
- Expired time cap reached count
- Pub Sub Channels
- Pub Sub patterns
- Connected Slaves
- Replication backlog bytes
- Replication backlog first byte offsets
- Replication backlog history bytes
- Master replication offset
- Secondary replication offset
- Slave expires tracked keys
- Slave priority
- Replicate resync Full
- Replicate Partial resync accepted
- Replica partial resync denied
- Cluster messages Sent Total
- Cluster messages Received Total
- Server threads total
- Long lock waits total
- Current client thread
- Connections Received Total
- Commands Processed Total
- Rejected Connections Total
- Net input bytes total
- Net output bytes total
- Expired keys total
- Evicted keys total
- Keyspace hits total
- Keyspace Misses total
- Used CPU Sys
- Used CPU User
- Used CPU Sys Children
- Used CPU User Children
Conclusion
In this article, we looked at how Prometheus and Hosted Grafana can help us do Redis performance monitoring without much setup.
Sign up here for a free trial of our Hosted Graphite and Grafana offerings. Also, if you have any questions about our products, or about how MetricFire can help your company, talk to us directly by booking a demo.


