
Table of Contents
Introduction
MetricFire offers a complete system, infrastructure, and application monitoring using a suite of open-source monitoring tools. With MetricFire, you can monitor all your infrastructure on a single dashboard. The platform displays metrics on Dashboards using Hosted Graphite.
This ecosystem of end-to-end infrastructure monitoring is offered by MetricFire by utilizing three of the most popular open-source monitoring software services - Graphite and Grafana. In addition to the application monitoring, you can perform network monitoring and server monitoring using MetricFire.
The major features of MetricFire include:
- Cloud Monitoring
- Hosted Graphite
- Grafana Dashboards
Among many, MetricFire provides:
- No vendor lock-ins: You can request a full export at any time of the day when you want to import your monitoring data into your infrastructure. You get all the benefits of an open-source tool with the reliability and protection of a SaaS tool.
- Easy Budgeting: You can establish easy budgeting plans within your limit through MetricFire’s structured pricing model. Its predictability and clear pricing will allow you to keep your expenses predictable and affordable.
- Transparency: All the aspects of MetricFire’s operations of SaaS monitoring are transparent. Our internal system metrics can be seen on our public status page.
- Robust Support: As engineers provide technical support for your engineers, you can expect comprehensive and relevant answers to your queries.
To learn more about MetricFire please go through the MetricFire blog posts. Also, you can book a demo with them, or sign on to the free trial today.
Amazon CloudFront
Amazon CloudFront is a fast and global content delivery network (CDN) service used to speed up web content distribution. A global network of data centres called edge locations is used for the delivery which has proxy servers that store contents. Taking advantage of AWS products gives developers and businesses an easy way to distribute content to end-users with low bandwidth, no minimum usage commitments, and high data transfer speeds.
CloudFront speeds up distributing your contents by routing each user request through the AWS backbone network and sourcing it from the edge location which is best fitted to serve your requests. There is always an edge location ready to deliver fast content to our customers as these servers are located across six continents. For example, if you produce your content in Asia but want to deliver it to North American users, you can use Amazon CloudFront to store it at the nearest edge location for the users. When a user from, say USA, wants to access your content, the user is directed to the North American edge server.
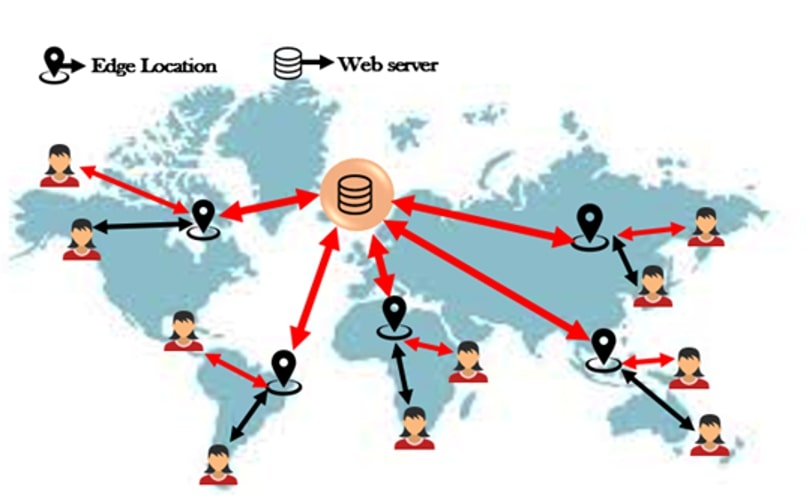
Image: AWS blog
CloudWatch and the Role of MetricFire
Amazon CloudWatch is a monitoring and management service. Actionable insights and data are provided by CloudFront for AWS, hybrid, and on-premises applications and infrastructure resources. You can accumulate and access all our performance and operational data in the form of metrics and logs using CloudWatch. You can utilize this to detect abnormal behavior in your environments, set alerts, envision logs and metrics side by side, take automated actions, investigate issues, and discover insights to keep our applications running smoothly.
Amazon CloudFront is fully integrated with Amazon CloudWatch. Six operational metrics per distribution are published automatically which are displayed in a set of graphs and here is where MetricFire’s role begins. MetricFire helps you launch your Amazon CloudWatch monitoring services. You can surface your metrics on dashboards by integrating Amazon CloudWatch and the MetricFire platform. You can choose and discard data views based on your preferences using its advanced filtering function and you can set up rules for it as well, plus receive alerts via email when a distribution issue is detected.
Graphite
Graphite is a highly scalable real-time monitoring system. It stores, retrieves, shares, and visualizes time-series data. Two important features of Graphite include:
- Storing numeric time-series data
- Rendering graphs of this data on demand
However, data is not collected by Graphite but it uses other tools that send data to Graphite.
Chris Davis at Orbitz originally designed and wrote Graphite in 2006 as a side project and then ultimately developed it to be the foundational monitoring tool. Orbitz released Graphite under an open-source license in 2008.
The architecture of Graphite consists of three software components:
- Carbon: Time-series data is fed into this twisted daemon.
- Whisper: Time-series data is stored in the simple database library.
- Graphite webapp: Graphs on-demand are rendered using Cairo by this Django webapp.
Some of the tools that integrate with Graphite are GitHub, Slack, Grafana, CloudBees, etc. Companies that use Graphite are Intercom, Ordergroove, CreativeGroup, etc.
Graphite API
Graphite-API is an API-based substitute for the Graphite web without any built-in dashboard. Fetching metrics from a time-series database like whisper, cyanite, etc. after which rendering graphs or JSON data out of these time series is its sole role. It is meant to be used along with any of the diverse Graphite dashboard applications (such as Grafana).
Why is Graphite-API better than Graphite-web?
- The Graphite-API utility is stateless and it does not require a SQL database.
- Python 2 and 3 are both supported.
- The HTTP API accepts JSON data and allows the formation of data and query string parameters.
- The user can install and configure this application easily thanks to its straightforwardness.
- Graphite-API structure is more straightforward, and moderate, and it has fewer moving parts than Graphite-web.
- It has a module-based design to allow coordination with time series databases or add more investigation capacities.
- The API codebase allows you to achieve wide test coverage and stable code quality.
Image: Franklinangulo blog
Graphite and the Role of MetricFire
The Graphite API does not have web or graphical interfaces. However, you can fill this gap with MetricFire. MetricFire took the good elements of open-source Graphite and turbocharged them with all the missing features making it much more powerful. An integrated collector agent, team accounts, granular dashboard permissions, and integrations to services and different technologies like AWS, Heroku, and logging tools are some of the add-ons to the native product.
We can choose and discard data views according to our needs using advanced filtering functions. We can set up alerts for marked events using multiple online channels, control access to our dashboards, collaborate and share it with our team, and modify or automate what we need to do through MetricFire’s Hosted Graphite. To learn more about MetricFire check our article.
Integrating Amazon CloudFront and Graphite APIs with Your Monitoring Systems
Sign up for a free trial with MetricFire to integrate Amazon CloudFront and Graphite APIs with the monitoring system. Book a demo and talk with the MetricFire team regarding how to integrate Amazon CloudFront and Graphite APIs and you can get Amazon CloudFront and Graphite APIs interacting with the MetricFire dashboards directly.
Amazon CloudWatch vs. Graphite
CloudWatch is a monitoring suite in AWS that records metrics generated by your applications and services and Graphite is a highly scalable real-time graphing system. CloudWatch is an AWS service with zero setup and compliance and it provides detailed monitoring and autoscaling integrations, backed by Amazon. Since it’s a native service in AWS, it integrates closely with other AWS services; whereas Graphite provides great customer support, custom metrics, Grafana dashboards, event annotations, and alerting with lots of notification options.
Hence, we can say that Amazon CloudWatch belongs to the "cloud monitoring" category, while Graphite can be categorized under "monitoring tools". The dominant reason by developers to use Amazon CloudWatch is "to monitor AWS resources" whereas the key factor to go with Graphite was stated as "to render any graph".
Graphite and Grafana
The graphs of Graphite are not visually appealing and hence Graphite has gone through criticism of its front-end visualizations. Grafana provides a more advanced solution for visualization as its main focus is on providing rich ways to visualize time series metrics and it’s relatively easy to connect to Grafana. That’s why Graphite and Grafana are often used in combination.
Data storage and its collection are done by Graphite and visualization is handled by Grafana. This way we achieve the best of both worlds. Graphite accurately provides the metrics, while Grafana provides an alluring dashboard for displaying these metrics through a web browser. This way it helps us overcome the drawbacks of graphite.
Conclusion
MetricFire specializes in monitoring diverse networks, applications, and systems. You can use it with minimal configuration to gain in-depth insight into our environments. Therefore, one can easily monitor Amazon CloudFront and display the metrics on fascinating dashboards by simply using Graphite API combined with Grafana using the MetricFire platform.
If you would like to learn more about it, please book a demo, or sign in to the free trial today.


