
Table of Contents
Great systems are not just built. They are monitored.
MetricFire runs Graphite and Grafana as a fully managed service for growing engineering teams, taking care of storage, scaling, and version updates so your team doesn't have to. Plans start at $19/month, billed per metric namespace rather than per host, and include engineer-staffed support. Integrations work natively with Heroku, AWS, Azure, and GCP, and data is stored with 3× redundancy in SOC2- and ISO:27001-certified data centres.
Introduction
Most teams run into alert noise long before they realize what is actually causing it.
At first it looks like an alerting problem. Too many alerts fire, thresholds feel wrong, and wildcard queries match more than expected. You tweak alert rules and silence a few things and, but the root issue usually starts earlier - at the point where metrics are defined.
Graphite does not understand services, components, or system boundaries. It only understands metric paths. Each metric is just a time series identified by its name, and any structure has to be encoded directly into that name. If that structure is missing or inconsistent, alerting becomes noisy by default. You end up reacting to individual metrics instead of understanding how a system is behaving.
This article focuses on that exact foundation. We will walk through how to structure metrics so they reflect services and their internal components, which we will refer to as signals. This creates a base that makes service-level alerting possible later on. This is the first article in a series on reducing alert noise in Graphite and in the next articles, we will build on this concept to show how to group metrics into alerts, and apply more advanced alert logic.
1: Prerequisites
This article assumes you are working with Graphite metrics that you control at the source.
In practice, that usually means application-level or service-level metrics emitted from your own code or instrumentation (because Graphite itself does not collect metrics). It receives data pushed from agents or applications and stores each metric as a time series. This distinction matters because naming flexibility only exists at the point where metrics are created.
If you are collecting metrics from integrations like HAProxy, NGINX, or system agents such as Telegraf, those metrics often come pre-structured. You can still query and alert on them, but you do not have full control over how they are named. That limits your ability to design clean service-level groupings.
The patterns in this article are most useful when you are:
- instrumenting your own services
- emitting custom metrics
- designing a naming scheme before sending data to a Carbon endpoint
Graphite itself expects you to define a naming hierarchy up front, where each segment (aka: dimension) of a metric path has a clear meaning. If you are unfamiliar with how metrics are sent into Graphite, this is a good starting point of reference: Feeding Data into Graphite (Carbon)
2: Why Metric Naming Determines Alert Quality
Graphite treats every metric as a standalone time series because there is no built-in awareness of services or relationships between metrics, and grouping is entirely based on the structure of the metric name. Each segment in a dot.separated.path acts as a level in a hierarchy, and that hierarchy is the only way Graphite can organize data (think of a typical folder => sub-folder structure). If naming is inconsistent or flat, grouping becomes unreliable. Consider a load balancing layer where metrics are defined like this:
lb_forwarder_requests
lb_worker_requests
lb_queue_depth
lb_backend_health
lb_latency_p95
lb_errors
At a glance, these look reasonable because they all relate to the same system, but Graphite does not understand that.
There is no shared hierarchy, only naming conventions embedded in strings. You cannot reliably group these metrics using wildcard (*) queries, and you cannot easily separate this system from others. As your environment grows, this becomes harder to manage. Now compare that to a structured approach:
<host>.lb.forwarder.requests.rate
<host>.lb.worker.requests.rate
<host>.lb.queue.depth.value
<host>.lb.backend.health.value
<host>.lb.latency.p95.value
<host>.lb.errors.rate.value
Here, the structure encodes meaning because all metrics share a consistent hierarchy and service boundary. Each segment in the path has a defined role, and that consistency is what makes wildcard grouping predictable.
Because the path depth is consistent, you can use a single wildcard pattern to evaluate all signals within the service, rather than needing multiple queries to account for different shapes. This becomes especially important when defining alerts that operate across a service. The difference here is not what is being measured, but how it is organized. In this structure:
- the first segment represents the host or instance
- the second segment represents the service
- the third segment represents the signal or component
- the remaining segments describe the measurement
This gives you a clear and repeatable model:
host => service => signal => measurement
Once metrics follow this pattern, grouping becomes intentional instead of approximate. Wildcards stop matching arbitrary sets of metrics and start representing real parts of your system, and that is what makes service-level alerting possible. This article also makes some similar points about why it's important to keep your Graphite metrics organized, and name them properly.
3: Designing Metrics for Service-Level Grouping
Defining Services and Signals
To make this structure useful, it helps to define two concepts clearly:
A service is a logical layer of your system which could be a load balancer, an API, a database, or a background worker system. It is the level at which you usually care about health and performance.
A signal is a component or behavior within that service that indicates its health. In a load balancing context, these are example of signals that might map to real responsibilities:
- forwarder handles routing traffic upstream
- worker processes incoming requests
- queue reflects buffering and backpressure
- backend health represents the availability of upstream systems
- latency captures request timing
Each of these signals is backed by one or more metrics and the naming structure ties them together under a single service (like lb). Graphite does not understand these relationships on its own so that's why it's important for you to define them through proper naming conventions.
Wildcard Grouping and Path Depth
Once metrics are structured around a consistent service hierarchy, wildcard queries become much more useful.
Graphite allows you to select groups of metrics using patterns, and those patterns operate directly on the metric path. When each segment in that path has a stable meaning and consistent depth, wildcard queries stop being approximate and start representing real system boundaries. Using the structured example from the previous section:
<host>.lb.forwarder.requests.rate
<host>.lb.worker.requests.rate
<host>.lb.queue.depth.value
<host>.lb.backend.health.value
<host>.lb.latency.p95.value
<host>.lb.errors.rate.value
You can now define a single pattern that captures all signals within the load balancing service, e.g: *.lb.*.*.*
Because each metric follows the same structure, this one pattern evaluates the entire service across all hosts..
Without that consistency, you typically end up writing multiple wildcard patterns to represent what is logically a single system. That adds complexity to dashboards and alert rules, and it increases the chances of missing or duplicating signals. With structure, wildcard queries map cleanly to real components of your system. Instead of matching arbitrary sets of metrics, they can represent a service and all components operating inside of it.
This becomes especially important for alerting. Rather than creating separate alerts for each signal (or component), you can evaluate the state of a service as a whole and then identify which signals within that service are responsible when something goes wrong. Graphite’s query model is entirely based on metric paths, so designing those paths with grouping in mind is what makes this possible.
Naming Conventions That Hold Up Over Time
Metric naming feels flexible early on, but becomes difficult to change as systems grow since each unique metric name is stored as its own unique time series. Once dashboards, alerts, and queries depend on that structure, changing it often requires significant rework. That is why it is worth defining a consistent hierarchy early. A simple pattern that works well in Graphite is:
<host>.<service>.<signal>.<signal>.<measurement>
For example:
<host>.lb.queue.depth.value
<host>.lb.latency.p95.value
This keeps the hierarchy predictable and ensures that each segment in the path has a defined meaning. Clarity also matters more than brevity - meaning that metric names should describe what is being measured in a way that remains understandable months later, not just when they are first created. Graphite hierarchy documentation also recommends keeping highly variable dimensions deeper in the hierarchy so that grouping remains stable. This helps ensure that wildcard queries continue to work as expected as your system evolves because as your environment scales, consistency becomes the thing that keeps monitoring maintainable.
Other common metric also include series like: environment (prod, staging, dev), region (us-east-1), availability zone (us-east-1a), app-name, cluster, etc.
When naming is predictable, queries are simpler, alerts are easier to maintain, and the system as a whole becomes easier to manage.
4: Applying These Concepts in MetricFire’s Hosted Graphite
In Hosted Graphite, this structure becomes immediately useful when exploring metrics.
Hosted Graphite wildcard queries operate on fixed positions in the metric path. This means patterns are not greedy across different path depths. If metrics within the same service use inconsistent structures, you often need multiple wildcard patterns to capture all of them. For example, a pattern like *.lb.* will only match metrics with that exact depth. It will not automatically include deeper paths such as:
<host>.lb.queue.depth.value
Because of this, consistent metric structure becomes important. When all metrics for a service follow the same depth, you can use a single wildcard pattern to represent that service. Using the structured example of:
<host>.lb.forwarder.requests.rate
<host>.lb.worker.requests.rate
<host>.lb.queue.depth.value
<host>.lb.backend.health.value
<host>.lb.latency.p95.value
<host>.lb.errors.rate.value
you can query all signal measurements within the load balancing service with a single pattern: *.lb.*.*.*
This allows you to explore how different components behave within the same service, without needing to manually stitch together unrelated metrics.
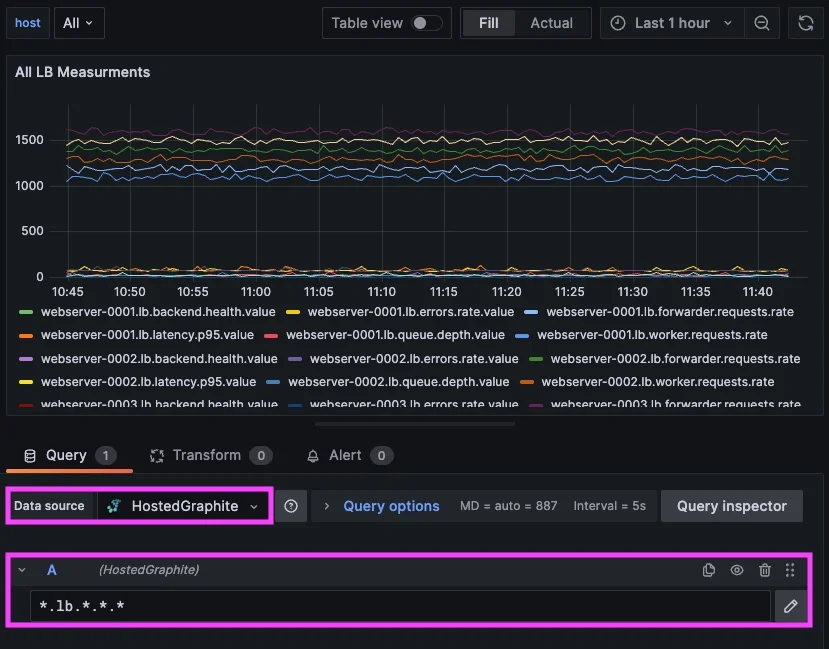
In practice, this makes it much easier to understand how a system behaves as a whole. You can look at the queue depth, request rate, latency, and backend health together, all scoped to the same service boundary. That context is what is typically missing when metrics are named inconsistently. This is also where your internal experience becomes relevant.
We ran into this exact issue within our own alerting infrastructure, specifically in a routing layer responsible for handling incoming traffic. Multiple components within that layer could fail at the same time, and each one generated its own alert, resulting in a cluster of alerts that all pointed to the same underlying issue.
After restructuring our metrics to follow a more consistent service and signal hierarchy, we were able to group those components under a single service-level alert. That made it possible to evaluate the health of the service as a whole and then identify which specific signals were responsible when something went wrong.
When working in Hosted Graphite, this structure translates directly into how you build dashboards and alerts. Queries become simpler because they rely on predictable paths, and alert rules can operate across a service rather than being tied to individual metrics. In the next articles, we will detail how to create efficient alerts with targeted wildcard groupings, and use composite alerts to add conditional AND/OR logic.
Conclusion
Alert noise is rarely caused by alerting alone and in Graphite, it usually comes from missing structure in metric names.
Because Graphite relies entirely on metric paths to organize data, naming becomes the foundation for everything else. If metrics are not structured around services and their internal signals, grouping becomes unreliable and alerts become noisy. By introducing a consistent hierarchy, you make it possible to:
- group metrics by service
- understand how internal components relate to each other
- define alerts based on system behavior
In the next article, we will build on this by showing how to use wildcard groupings to create service-level alerts, and how to surface only the signals responsible when something goes wrong.

