
Table of Contents
Great systems are not just built. They are monitored.
MetricFire runs Graphite and Grafana as a fully managed service for growing engineering teams, taking care of storage, scaling, and version updates so your team doesn't have to. Plans start at $19/month, billed per metric namespace rather than per host, and include engineer-staffed support. Integrations work natively with Heroku, AWS, Azure, and GCP, and data is stored with 3× redundancy in SOC2- and ISO:27001-certified data centres.
Introduction
Most alerting systems start by defining thresholds on individual metrics so that when a value crosses that threshold, an alert is triggered. This approach works fine when systems are small, but it becomes difficult to manage as services grow and expose more signals.
A single service often produces multiple related metrics. Throughput, latency, queue depth, and health could all describe different aspects of the same system. Alerting on each of these components independently leads to duplication, and more importantly, it removes the context that ties them together.
In the previous article, we focused on structuring metrics so that services and their signals are clearly defined within the metric hierarchy.
In this article, we build on that foundation by using Graphite wildcard queries (*) to group related metric signals into meaningful alert definitions. Instead of creating alerts per metric, we define alerts around services and their internal components, and evaluate the specific metrics responsible when those alerts fire.
1: Why Metric-Level Alerts Can Create Noise
Consider the load balancing layer from the previous article. It exposes multiple signals that describe how traffic is being handled.
<host>.lb.forwarder.requests.rate
<host>.lb.worker.requests.rate
<host>.lb.queue.depth.value
<host>.lb.health.status.value
<host>.lb.latency.p95.value
Each of these metrics is valid on its own, but they are all part of the same system. Now imagine a failure scenario where traffic begins to back up. Maybe the queue depth increases, latency rises, and request throughput drops. If alerts are defined per metric, each of these signals can trigger independently. What you end up with is multiple alerts describing a single issue, each lacking the broader context of the service.
This is where alert noise starts to become a problem because the issue is not the signals themselves, but how they are grouped when defining alerts.
2: Using Wildcards to Define Meaningful Alert Groupings
Wildcard queries allow you to group related metrics together based on their position in the metric path. The key is to group metrics in a way that reflects how you want to reason about the system. So instead of trying to alert on every signal within a service at all once, it is often more useful to group by signal type.
For example, rather than: *.lb.*.*.*
(which includes metrics with very different units and behaviors), a more practical grouping could be: *.lb.*.requests.rate
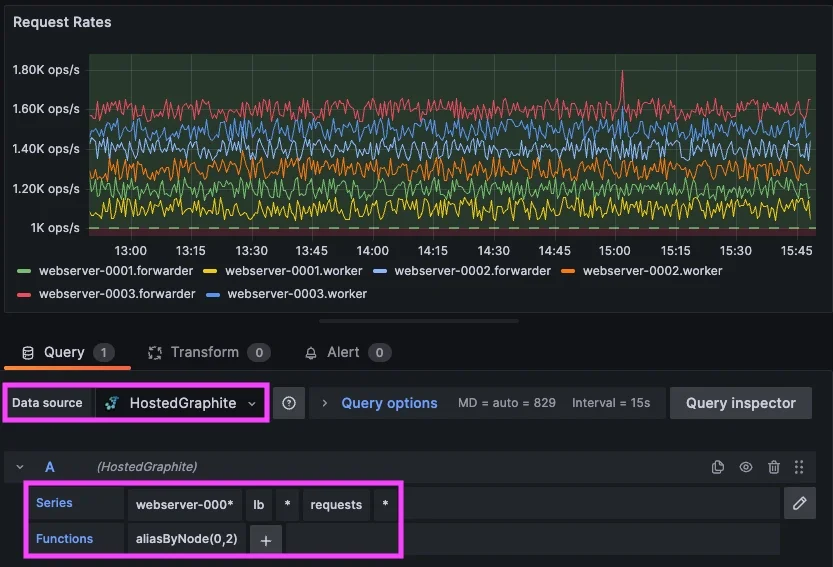
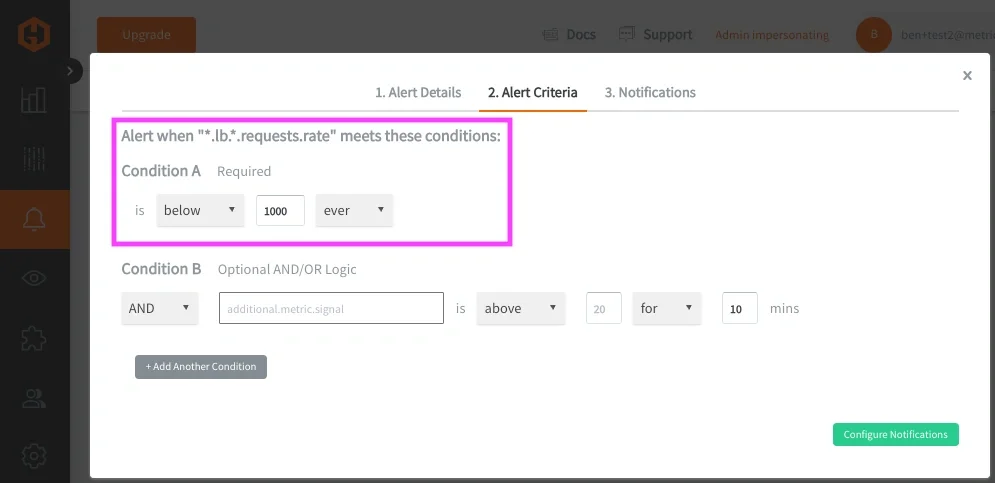
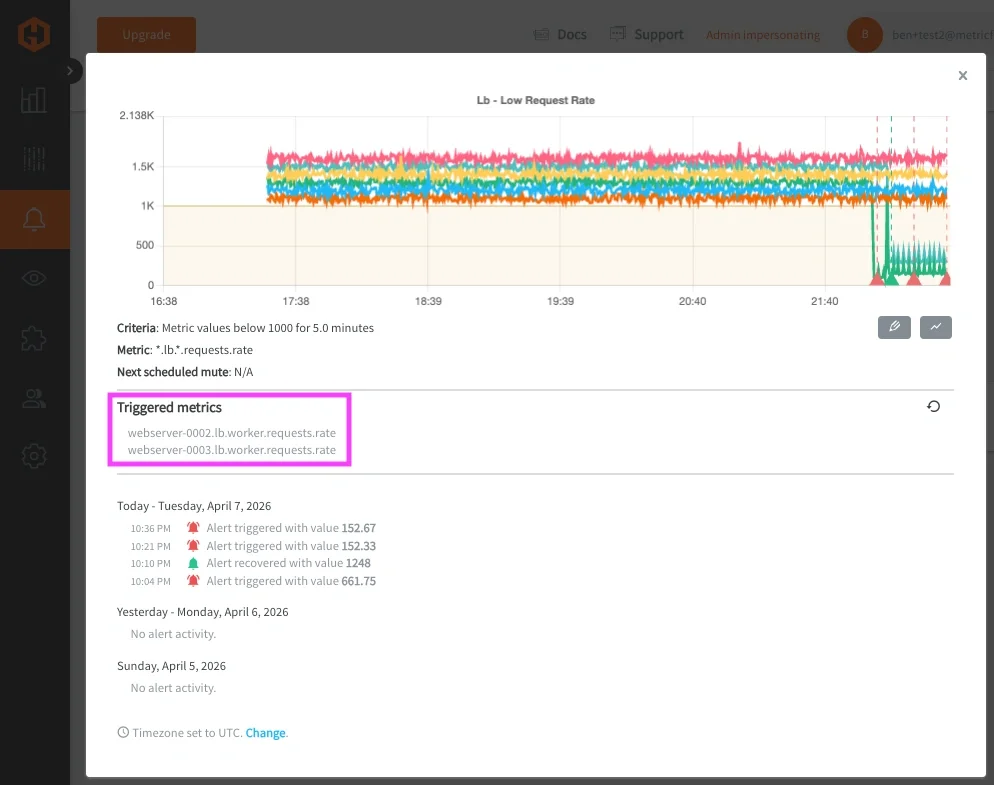
This query grabs request throughput metrics across all load balancer hosts/components and because these metrics share the same unit and meaning, they can be evaluated together. This allows you to define a single alert that represents request handling across the service. An example of this alert criteria could be: "Trigger an alert if any load balancer request rate ever drops below 1000 req/sec." When this alert fires, it represents a degradation in the service’s ability to process traffic requests, rather than an issue with a single metric.
In most cases, these wildcard alerts evaluate each matched time series independently, which means a single degraded signal can trigger the alert and be returned as an offending metric. Now this pattern can be applied across multiple services and signal types:
- Latency across all hosts/services can be grouped with: *.*.latency.p95.value
- Memory usage across hosts can be grouped with: telegraf.*.mem.used_percent
- Health checks across hosts/services can be grouped with: *.*.health.status.value
Each of these alerting queries defines a meaningful grouping based on how a systems service behaves, rather than individual components running within the service.
Why Metric Structure Still Matters
These groupings work well because the metric structure is consistent. Each segment in the metric path has a defined meaning:
<host>.<service>.<signal>.<metric>.<stat>
Because of this, wildcard queries can target specific dimensions such as service, signal, or measurement type without ambiguity.
It's not always possible to maintain system metrics at a consistent depth, but it is helpful to do this when possible to make alert grouping more reliable and alert definitions easier to maintain. For more details on this concept, please see our related article around Metric Naming Best Practices.
3: Expanding This Pattern Across Services
The load balancing layer is a good starting point because the signals are easy to reason about, but the same pattern becomes more valuable as you apply it across multiple services.
In a typical system, requests move through several layers. In this example, we defined metrics for a load balancer, an API layer, background job processing, and a database. Each service exposes a different set of signals, but they all follow a similar structure and can be grouped using the same approach.
For the API layer, request throughput and latency become the primary signals:
*.api.*.requests.rate
*.*.latency.p95.value
For background processing, queue depth and job throughput describe system behavior:
*.jobs.queue.depth.value
*.jobs.*.processed.total.rate
For the database, query rate and latency indicate load and performance:
*.db.*.queries.total.rate
*.db.*.latency.p95.value
And across all services, application health metrics and system performance metrics (from agents like Telegraf) provide a consistent view of availability and resource usage:
*.*.health.status.value
telegraf.*.mem.used_percent
Each of these queries groups metrics in a way that reflects how engineers think about the system. Instead of focusing on individual time series, you are evaluating behavior across a service or a signal type. When these alerts are configured, they behave consistently across services. A latency alert does not need to be redefined for each layer. A health alert does not need to be duplicated per host. The same wildcard pattern applies, and the alert output identifies which service and which host is affected.
This is where the structure from the previous article becomes important. Because each metric follows the same hierarchy, you can scale this approach across the entire system without introducing additional complexity. At this point, dashboards and alerts start to align. In Grafana, each service can be visualized with panels for throughput, latency, and capacity. In alerting, those same groupings become the basis for service-level alerts. The result is a monitoring model where:
- dashboards show how services behave over time
- alerts indicate when that behavior crosses a threshold
- returned metrics identify the specific signals responsible
To make this more concrete, the following dashboard example shows how these groupings look in practice, across multiple hosts/services:
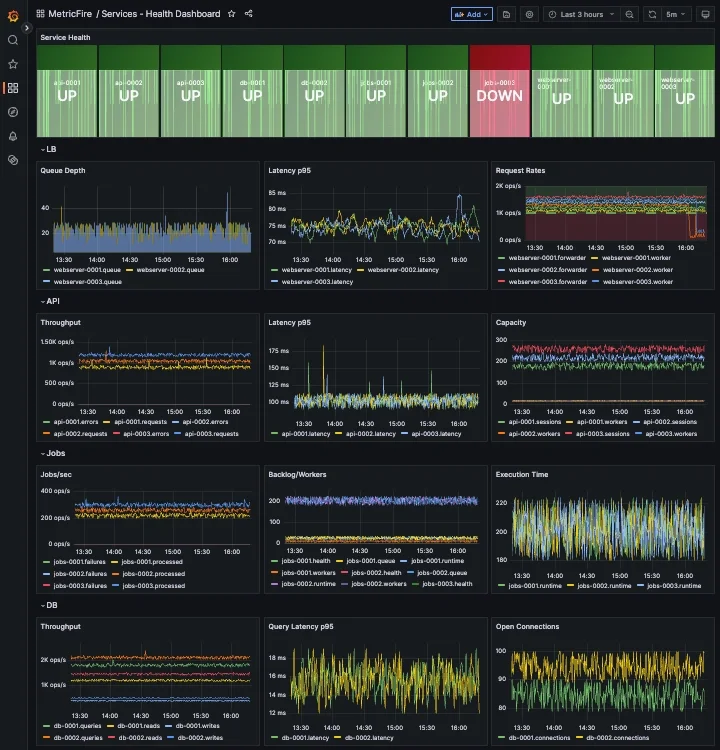
This makes it much easier to move from detection to diagnosis without switching context or manually correlating multiple alerts.
4: Applying These Concepts in MetricFire’s Hosted Graphite
In Hosted Graphite, this approach maps directly to how alerts are configured.
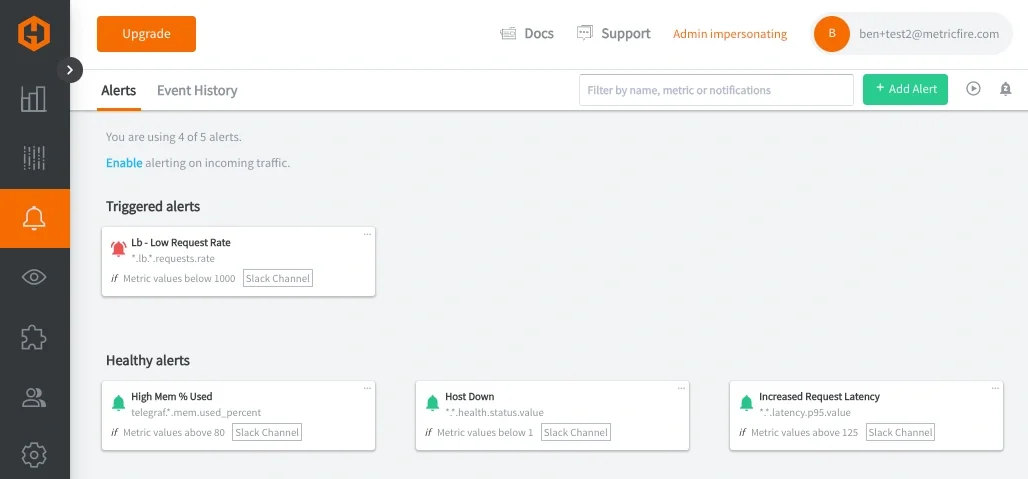
Wildcard queries are used to define the scope of the alert, whether that is a specific service or a signal type across multiple services. Alert conditions are applied to those grouped metrics, and when triggered, the alert returns only the metrics that exceed the defined threshold. This reduces the number of alert rules required and makes alerts easier to interpret when they fire. In practice, this means:
- one alert for LB throughput
- one alert for latency across all services (api, cache, DB)
- one alert for memory usage across all hosts
- one alert for service health
So instead of managing dozens of individual alerts, you define a small number of grouped alerts that reflect how the system actually behaves.
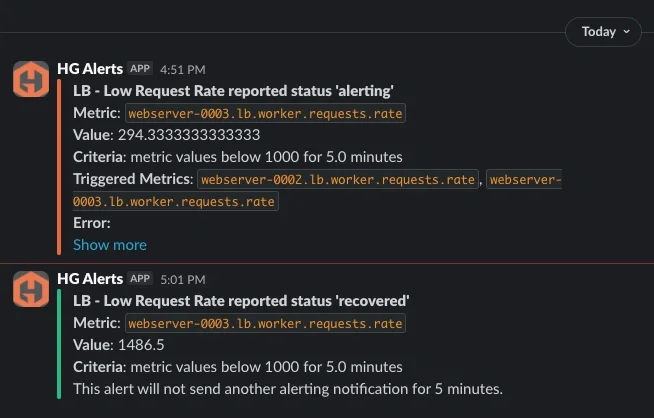
Once defined, these alerts can be routed through notification channels such as email, Slack, PagerDuty, MSTeams, or webhooks. The delivery mechanism remains the same, but the signal quality improves significantly.
At MetricFire, we ran into this exact issue within our own alerting infrastructure, specifically in a routing layer responsible for handling incoming traffic. Multiple components within that layer could fail at the same time and each one generated its own alert, resulting in a cluster of alerts that all pointed to the same underlying issue.
After restructuring our metrics to follow a more consistent service and signal hierarchy, we were able to group those components under a single "service-level" alert. That made it possible to evaluate the health of the service as a whole and then identify which specific signals were responsible when something went wrong.
When working in Hosted Graphite, this structure translates directly into how you build dashboards and alerts. Queries become simpler because they rely on predictable paths, and alert rules can operate across a service rather than being tied to individual metrics. In the next articles, we will detail how to create efficient alerts with targeted wildcard groupings, and use Composite Alerts to add conditional AND/OR logic.
Conclusion
Metric-level alerting becomes noisy because it treats each signal independently, without considering how those signals relate to a service.
By grouping Graphite metrics using wildcard queries, alerts can be defined around meaningful dimensions such as throughput, latency, and health. Returning only the offending metrics adds the context needed to quickly understand what changed. The result is fewer alerts, clearer signals, and faster response.
In the next article, we build on this by introducing composite alerting, where multiple signals are evaluated together using conditional logic (AND/OR) to detect more complex system behavior.


