
Table of Contents
Great systems are not just built. They are monitored.
MetricFire runs Graphite and Grafana as a fully managed service for growing engineering teams, taking care of storage, scaling, and version updates so your team doesn't have to. Plans start at $19/month, billed per metric namespace rather than per host, and include engineer-staffed support. Integrations work natively with Heroku, AWS, Azure, and GCP, and data is stored with 3× redundancy in SOC2- and ISO:27001-certified data centres.
Introduction
Modern applications generate far more insight than CPU and memory metrics alone can provide. Application-level signals like request counts, request latency, error rates, and user-driven events are often the fastest and most reliable way to understand how your software is actually behaving in production.
In this article, we’ll show how easy it is to send custom application metrics directly to MetricFire's public carbon endpoint. We’ll build a small Flask application, emit a handful of practical metrics, and generate local traffic to demonstrate how quickly meaningful data can flow from your code to your dashboards.
How MetricFire Accepts Custom Metrics
MetricFire's Hosted Graphite supports the Graphite plaintext protocol over TCP, UDP, Pickle, and StatsD. This means you can send metrics by opening a socket and writing a single line of text. Each metric follows this format:
<API_KEY>.<metric.path> <numeric_value>
This simplicity makes Hosted Graphite easy to integrate into almost any application or language, without requiring an agent or SDK. See the HG Language Guide for code examples in all major programming languages. In this example, we'll use HG's Python3 code example to send custom metrics to carbon.hostedgraphite.com:2003, by opening a socket connection via TCP:
import socket
conn = socket.create_connection(("YOUR-UID.carbon.hostedgraphite.com", 2003))
conn.send("<API_KEY>.<metric.path> <numeric_value>\n".encode('utf-8'))
conn.close()
Prerequisites
To follow along with this example, you’ll need:
- Python 3: any recent version will work
- Pip: Python’s package installer
- Flask: a lightweight Python web framework used for small apps/tasks
If you’re on macOS or Linux and can run python3 and pip, you’re likely already set!
Choosing Three Core Application Metrics
To keep things practical, we’ll focus on three metrics that are broadly useful across most applications:
- Request count: how much traffic your app is handling
- Request latency: how long requests take to complete
- Error count: how often requests fail
- Button clicks: a common application event to track
Together, these give you immediate insight into load, performance, and reliability.
Minimal Flask App That Sends Custom Metrics
Below is a single-file Flask application that sends metrics directly to Hosted Graphite. There are no environment variables, background workers, or extra dependencies, just Flask and Python’s standard library (make sure to add your HG API KEY).
from flask import Flask, request
import time
import socket

app = Flask(__name__)

HG_API_KEY = "YOUR-API-KEY"
HG_HOST = "carbon.hostedgraphite.com"
HG_PORT = 2003
PREFIX = "demo.flask"


def hg_send(metric_path, value):
    line = f"{HG_API_KEY}.{PREFIX}.{metric_path} {value}\n"
    s = socket.create_connection((HG_HOST, HG_PORT), timeout=2)
    try:
        s.sendall(line.encode("utf-8"))
    finally:
        s.close()


@app.before_request
def start_timer():
    request._start = time.perf_counter()


@app.after_request
def emit_metrics(response):
    try:
        latency_ms = (time.perf_counter() - request._start) * 1000
        hg_send("http.requests", 1)
        hg_send("http.request_latency_ms", latency_ms)
        if response.status_code >= 500:
            hg_send("http.errors", 1)
    except Exception:
        pass
    return response


@app.get("/")
def home():
    return {"ok": True}


@app.get("/sleep")
def sleep():
    s = float(request.args.get("s", "0.2"))
    time.sleep(s)
    return {"ok": True, "slept": s}


@app.get("/error")
def error():
    return {"ok": False, "error": "intentional demo error"}, 500


@app.get("/click")
def click():
    try:
        hg_send("events.button_clicks", 1)
    except Exception:
        pass
    return {"ok": True}


if __name__ == "__main__":
    app.run(debug=True)
Now just run your Flask app locally:
python app.py
If you don't have a Hosted Graphite API KEY, you can obtain one when you start a FREE 14-day trial with MetricFire!
What Metrics This App Will Forward
As the app runs, it produces the following metrics:
- demo.flask.http.requests - increments on every request
- demo.flask.http.request_latency_ms - records latency per request
- demo.flask.http.errors - increments for HTTP 500 responses
- demo.flask.events.button_clicks - application event
These metrics will be immediately searchable and graph-able in MetricFire.
Generating Example Traffic Locally
To simulate user behavior, you can run a simple loop from another terminal window that hits multiple endpoints, with some small delays between requests:
while true; do
  curl -sS http://127.0.0.1:5000/ >/dev/null 2>&1
  sleep 1
  curl -sS "http://127.0.0.1:5000/sleep?s=0.2" >/dev/null 2>&1
  sleep 2
  curl -sS http://127.0.0.1:5000/click >/dev/null 2>&1
  sleep 3
  curl -sS http://127.0.0.1:5000/error >/dev/null 2>&1
  sleep 5
done
This loop runs continuously, produces no terminal output, and can be stopped with Ctrl + C. The staggered timing creates metrics that can be visualized on graphs that somewhat resemble user traffic.
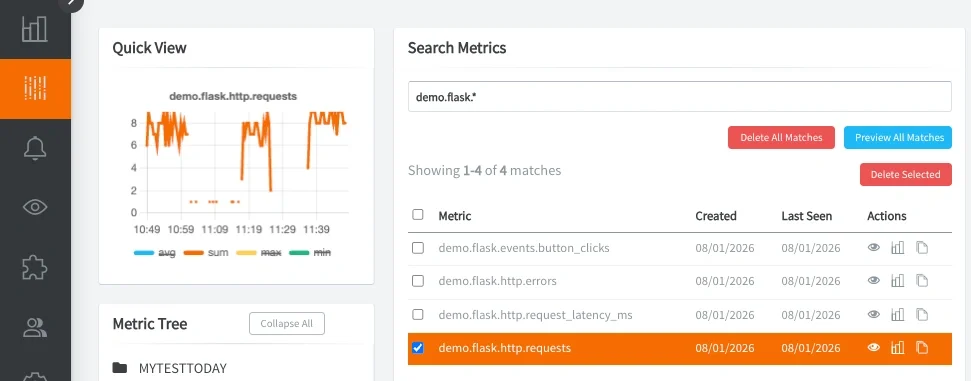
Viewing the Metrics in Hosted Grafana
Once traffic is flowing, you can search for your metric prefix (demo.flask.*) in MetricFire's Hosted Grafana. You should see request rates, latency trends, error counts, and custom event activity updating in real time. You can locate your metrics in the HG Metrics Search UI:
Then from within the HG app, navigate to Dashboards to access your Hosted Grafana and create a new dashboard with some panels:
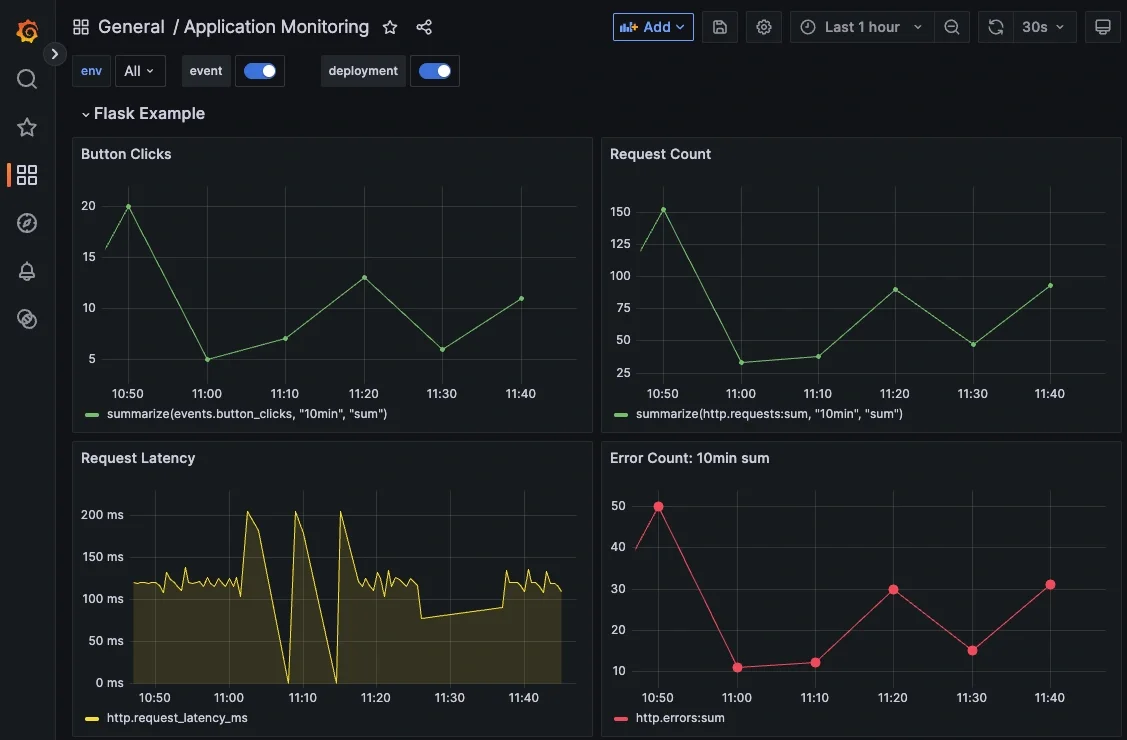
Because the metrics are plain Graphite paths, you can aggregate, alert, and visualize them using standard Graphite/Grafana functions.
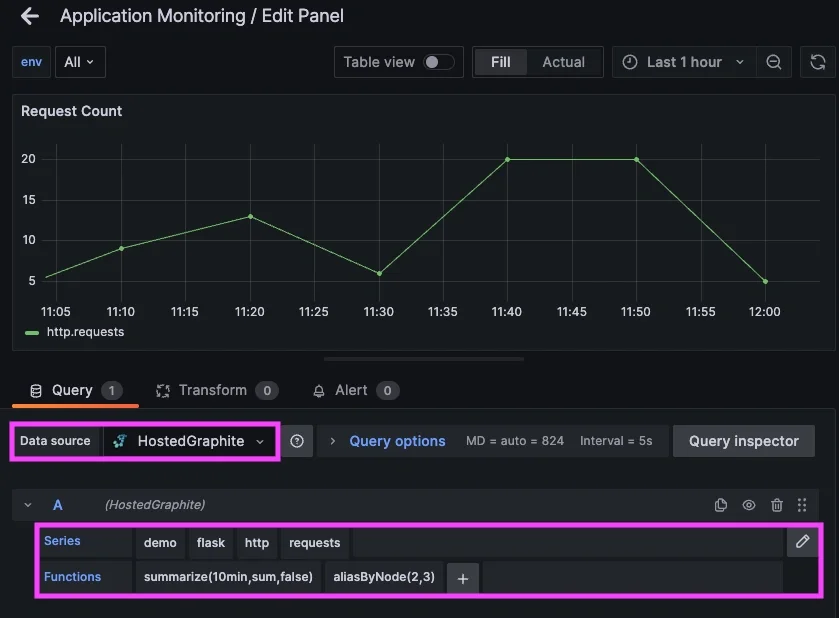
See the HG docs for more details on creating custom Dashboards and Alerts.
Using These Concepts in Practice
In production environments, SRE and DevOps teams use similar methods to instrument applications with a small set of well-defined metrics that describe service behavior over time. These metrics are typically emitted at request boundaries, around critical code paths, and at integration points with downstream dependencies. Rather than treating metrics as ad-hoc logs, teams rely on consistent metric names and units to establish clear service-level indicators such as request rate, latency distributions, and error rates.
Once collected and stored, these metrics power dashboards, alerts, and automated responses. SRE teams use metrics to detect regressions, validate deployments, and correlate application behavior with infrastructure changes. Over time, application metrics become the primary signal for reliability work to guide capacity planning and tune performance, while remaining lightweight enough to be emitted continuously without impacting production systems.
Conclusion
Sending custom application metrics to MetricFire doesn’t require complex tooling, agents, or heavy instrumentation. With just a few intentional lines of code, you can begin emitting meaningful signals (latency, errors, user-driven events) directly from your application into Hosted Graphite.
This approach makes it easy to start small and stay focused on what actually matters. As your application grows and changes, the same pattern can naturally expand alongside it, giving you deeper visibility over time and helping you diagnose issues faster, understand behavior more clearly, and make better decisions about performance and reliability.
Sign up for the free trial and begin monitoring your infrastructure today. You can also book a demo and talk to the MetricFire team directly about your monitoring needs.


