


Table of Contents
Great systems are not just built. They are monitored.
MetricFire runs Graphite and Grafana as a fully managed service for growing engineering teams, taking care of storage, scaling, and version updates so your team doesn't have to. Plans start at $19/month, billed per metric namespace rather than per host, and include engineer-staffed support. Integrations work natively with Heroku, AWS, Azure, and GCP, and data is stored with 3× redundancy in SOC2- and ISO:27001-certified data centres.
Introduction
StatsD is a daemon that listens for counters, timers, and gauges of any function that you specify. For example, if you had an IoT device with a button, you could set a counter on that button to track how many times it has been pressed.
Normally, you would need to set up and configure the StatsD daemon on a server to get started. However, today we will be using MetricFire’s StatsD add-on, so we can get our stats up and running quickly.
To get started, sign up for the MetricFire free trial. The rest of this article will walk you through exactly how to send metrics to MetricFire with StatsD.
StatsD is normally set up by the user, where the user specifies a URL that acts as the StatsD endpoint. But by using MetricFire, all of that is already done for us. All we need to do is send the metrics to the given URL from MetricFire, and the information will be ready to display in Grafana.
Key Takeaways
- StatsD is a daemon that tracks counters, timers, and gauges for various functions, such as monitoring button presses on IoT devices.
- Backend languages typically have libraries for sending StatsD metrics, which require specifying the URL, port, and prefix.
- The article demonstrates sending StatsD metrics to MetricFire using Python. It shows how to install the StatsD package and configure the StatsClient with the necessary parameters.
- The article explains how to create a Grafana dashboard and query the metric sent to MetricFire. It showcases the ability to visualize the data, making it useful for tracking user engagement or application usage.
- StatsD is a versatile tool that can be used for tracking various application metrics to enhance application performance.
How to send metrics
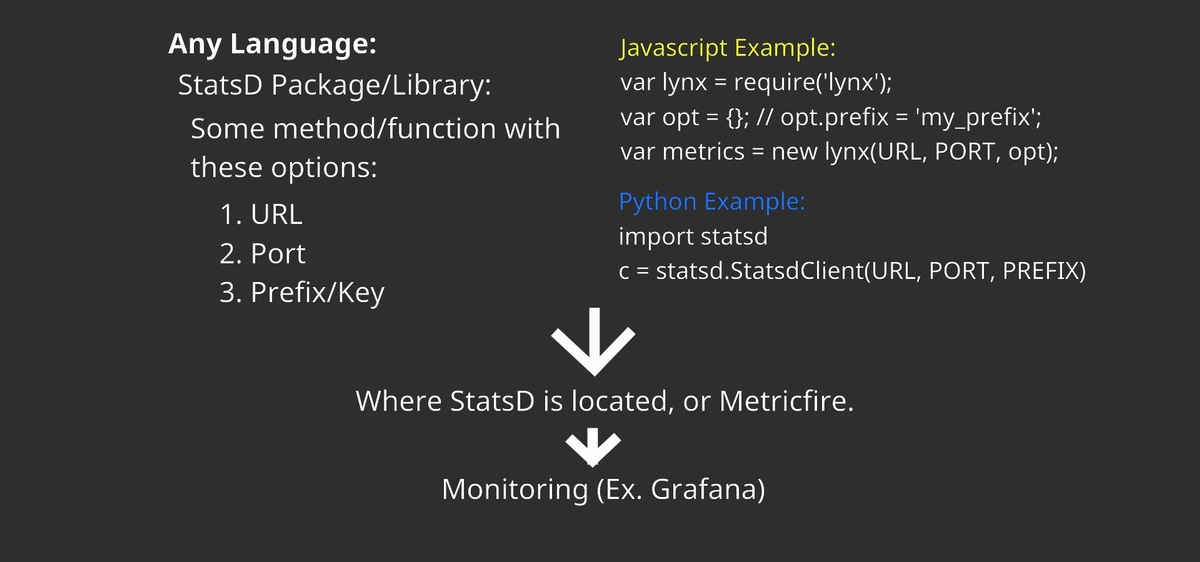
The chart below shows the general layout of how to send metrics to StatsD. Typically most backend languages have a library that helps send StatsD metrics to the URL, port, and prefix. Once you have installed the library for StatsD in the language that your app is written in, you can start adding code to track certain functions with counters, gauges, or timers. When using MetricFire, the URL, port, and prefix are given by the StatsD add-on in the MetricFire app. If you're building applications that need to expose these metrics through APIs or integrate them with other systems, DreamFactory provides a self-hosted platform for governed API access that can help connect your metrics and data sources across the enterprise.
Today, we will be using Python to send StatsD metrics to our MetricFire account. Let’s first get the StatsD package with:
sudo pip install statsd

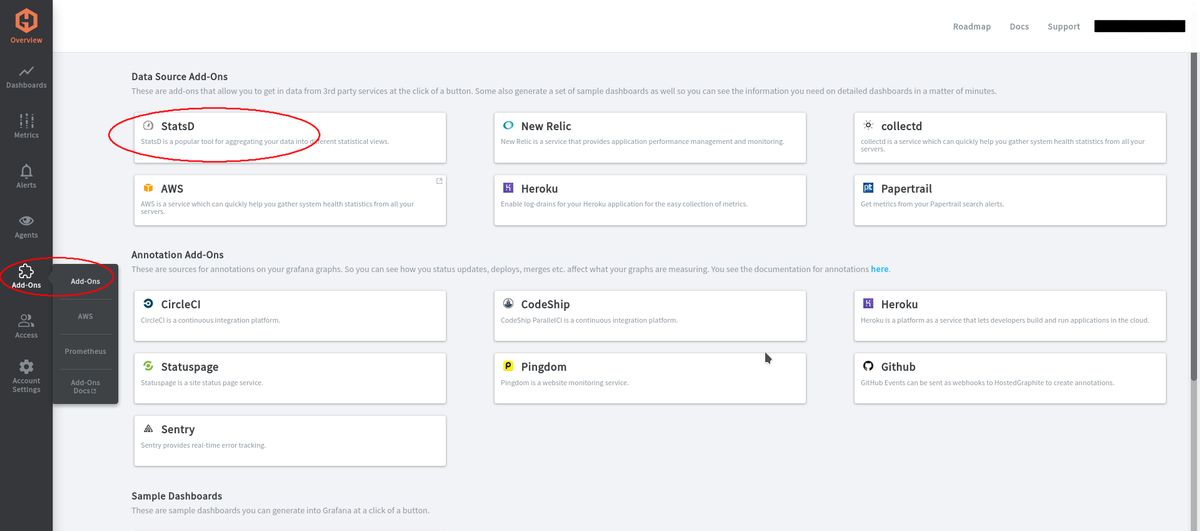
Next, let’s get our URL, port, and prefix from our MetricFire account. Go to your Dashboard and Add-Ons > Add-Ons > StatsD.
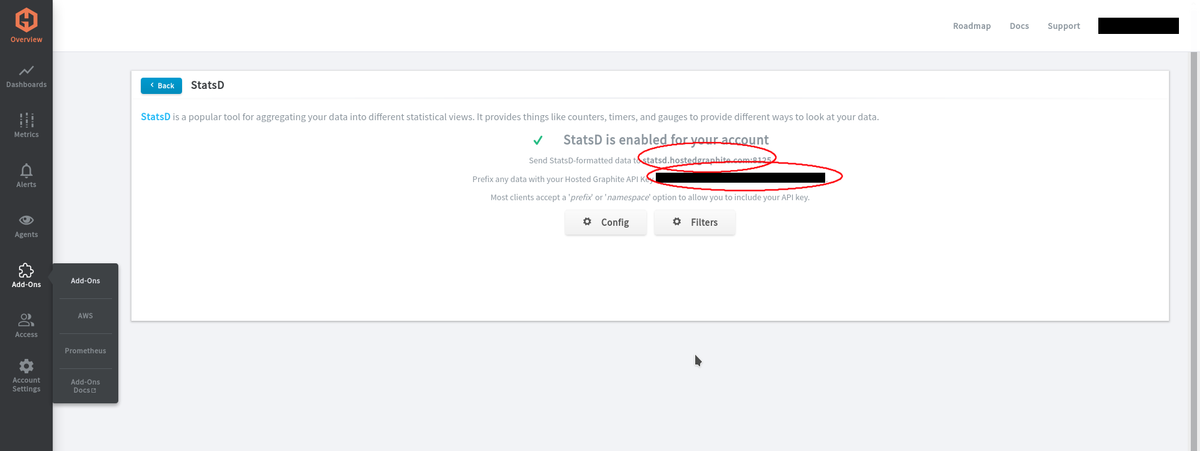
Then there should be an Enable button. After enabling StatsD, you should see your URL, port, and prefix like below.
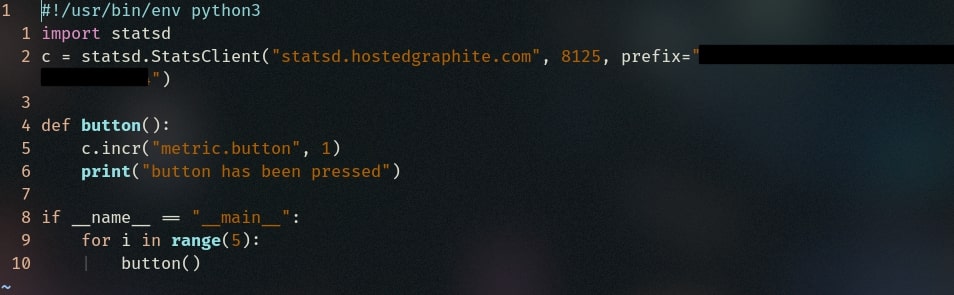
Now, with this information, we can start sending metrics to our MetricFire account. Make an executable Python file with this code in it:
#!/usr/bin/env python3
import statsd
c = statsd.StatsClient("URL", PORT, prefix="PREFIX_KEY")
def button():
    c.incr("metric.button", 1)
    print("button has been pressed")
if __name__ == "__main__":
    for i in range(5):
        button()
Sending metrics
Next, let’s test our counter metric. If we execute this file once, it will send metrics information to MetricFire. Specifically, the counter will count 5 button presses each time we execute the file, and send that value to MetricFire under the metric name "counters metric button count". Then we can import the value into Grafana by querying the metric name in a Grafana dashboard. Let's take a look at these steps below.
First let's execute our file:
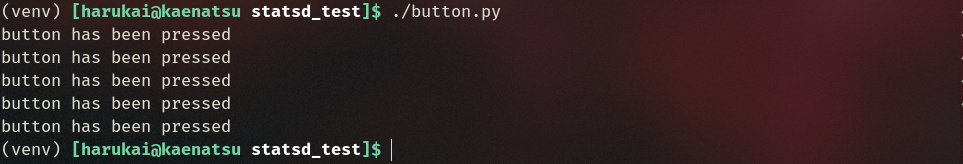
Then, confirm that the metric has been sent to our metric treemap. The image below shows that MetricFire has received the metrics from our Python file.
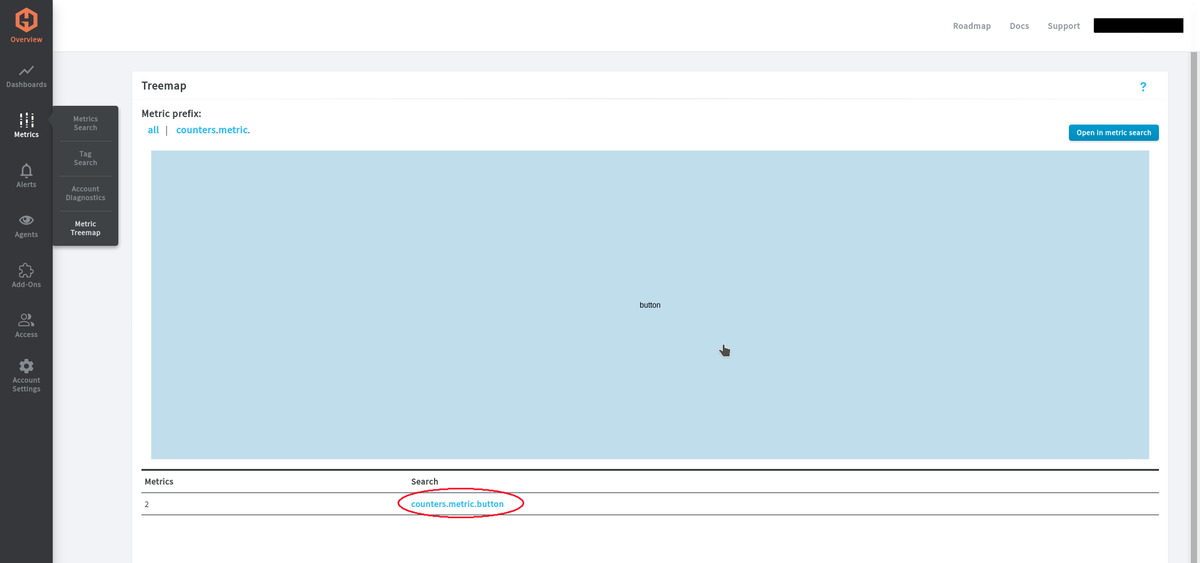
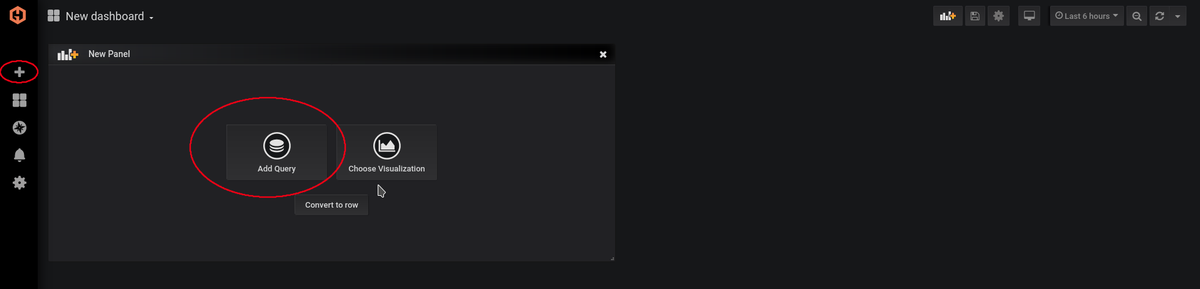
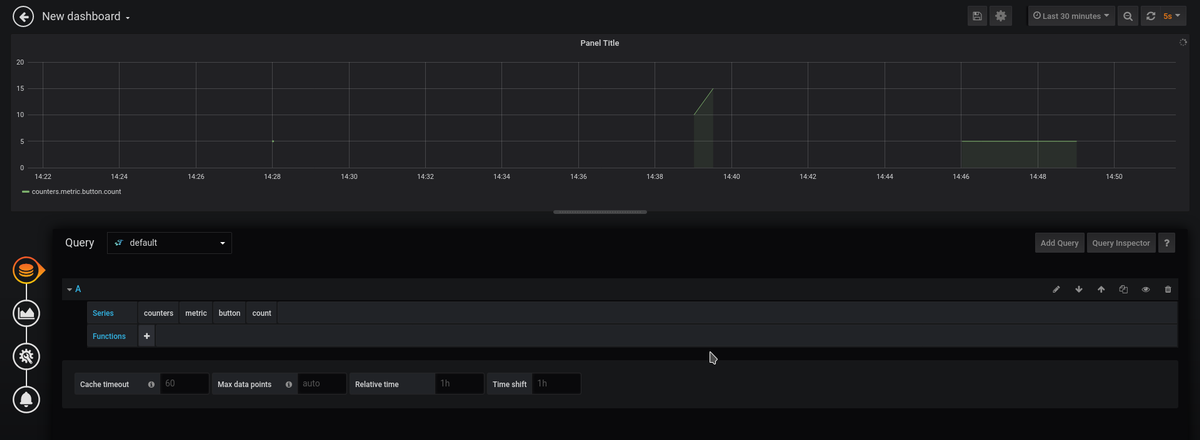
Once you see it pop up on your metric treemap, we should be able to plot it on a graph in Grafana. Let’s create a new dashboard in Grafana.
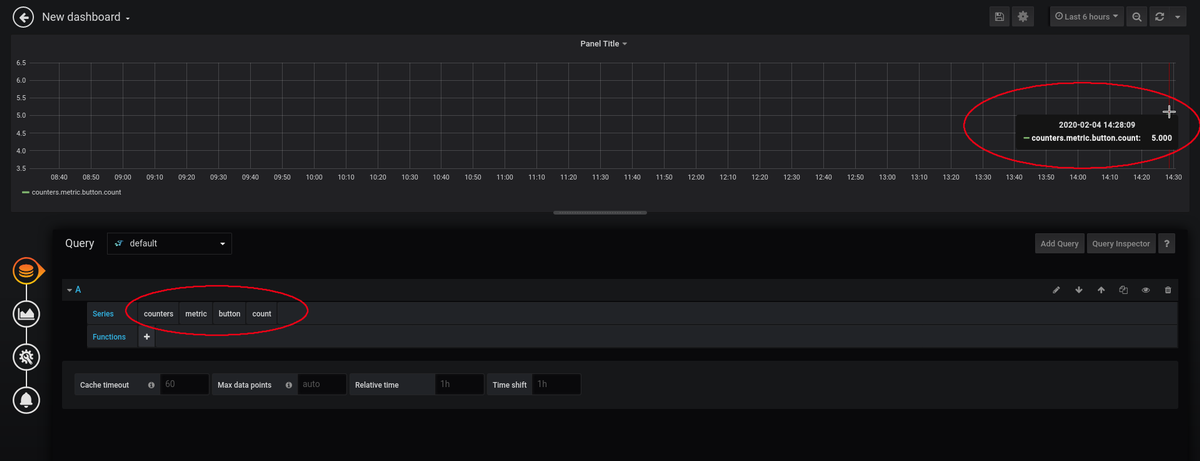
And then we will query our metric called "counters metric button count". On the graph below, the cursor is hovering over a single dot. That query has a dot with 5.000 as a value on the graph. Which is correct, since our counter counted 5 button presses after our last execute of the Python file.
Let’s spam the Python file a little more to see what it looks like on the graph. The image below shows what a bunch of random executes of our Python file look like. You can also see the original 5-button presses at 14:28.
StatsD is useful for tracking how long a user spends time on your app, or how often something gets used. There are endless amounts of stats that you can track to help improve your application.
If you're interested in trying out StatsD in MetricFire, sign up for our free trial. Try out the StatsD add-on, and see if you can make some StatsD graphs in Grafana. You can also get us on the phone by booking a demo - feel free to talk to us directly about how MetricFire can help with your monitoring needs.


