 +
+

To integrate GCP Memorystore for Redis with MetricFire, please sign up for a free 14 day trial. We want to fully understand your requirements and monitoring goals, so we can advise you on how to obtain better visibility into your infrastructure. Please book a demo with us so we can show you how quick and easy it is to get meaningful data into your MetricFire account, and use that data to build custom dashboards and alerts.
Monitoring your Google Cloud Platform services is easy with the convenient integration provided by MetricFire. See our Hosted Graphite GCP docs for detailed steps on how to configure this integration.
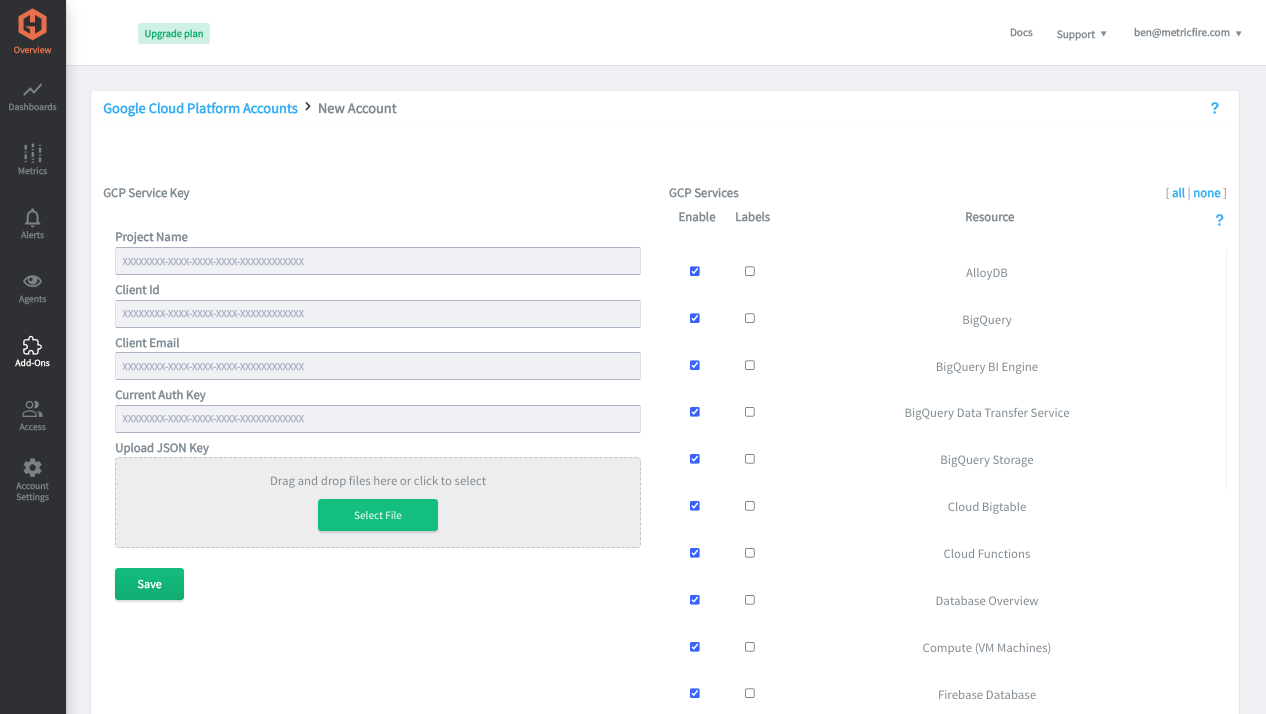
In your Hosted Graphite account, just drag and drop your GCP Service Key into Add-Ons => GCP, select which services you want to pull metrics from, optionally enable labels (tags), and save:
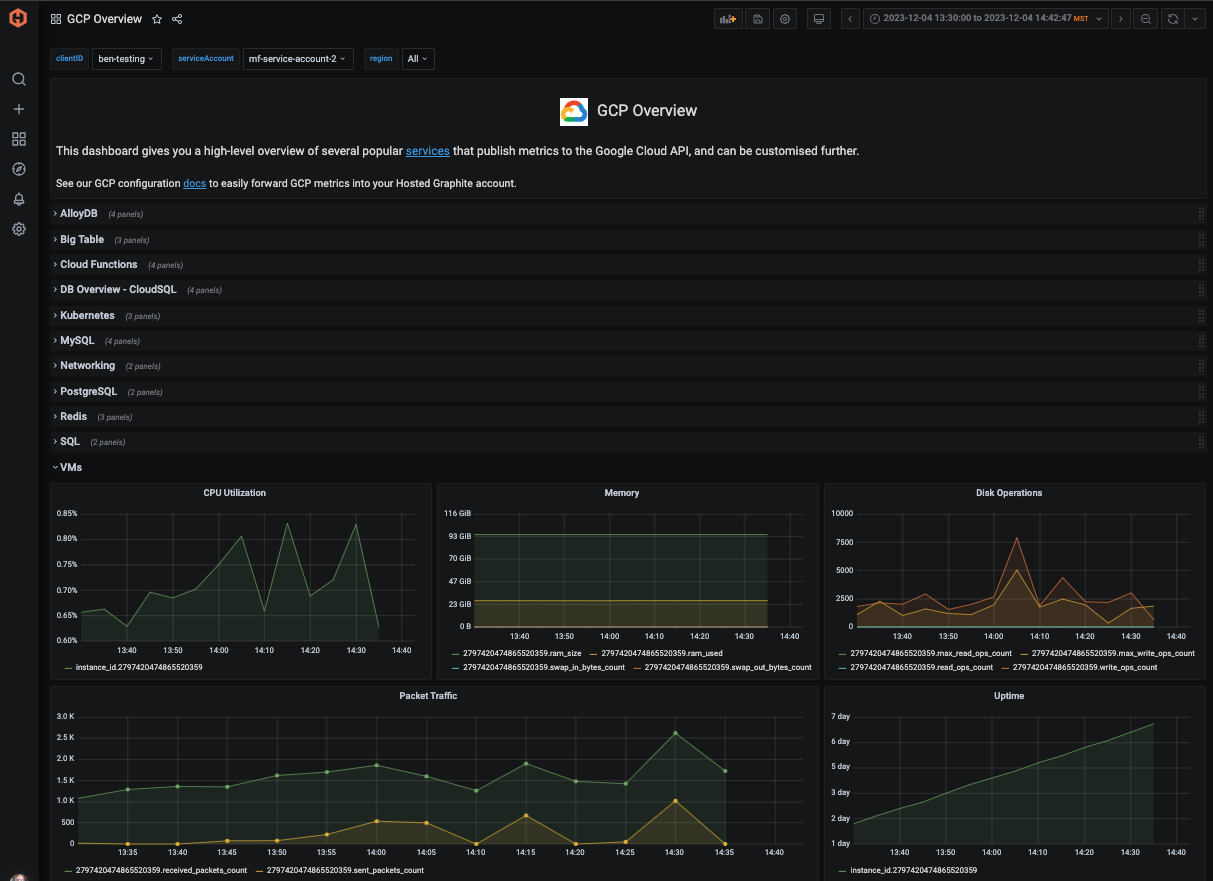
Once your credentials are configured and services are selected, you will see GCP metrics appear in your Hosted Graphite account. You can then use these metrics to create custom dashboards and alerts. We also offer a convenient GCP Overview dashboard that can be generated from our Dashboard Library, which offers a great starting point:
If there are any GCP services that are not listed in our integration, please let us know and we would be happy to build it out for you!
MetricFire is a full-scale platform that provides infrastructure, system, and application monitoring using a suite of open-source tools. We will aggregate and store your data as time series metrics, which can be used to build custom dashboards and alerts. MetricFire takes away the burden of self-hosting your own monitoring solution, allowing you more time and freedom to work on your most important tasks.
MetricFire offers a complete ecosystem of end-to-end infrastructure monitoring, comprised of open-source Graphite and Grafana. MetricFire handles the aggregation, storage, and backups of your data, and offers alerting, team features, and API's for easy management of your monitoring environment. You can send server metrics using one of our agents, custom metrics from within your application code, and integration metrics from a variety of popular 3rd party services that we integrate with like Heroku, AWS, Azure, GCP, and many more!
Our Hosted Graphite product has improved upon standard Graphite to add data dimensionality, optimized storage, and offers additional tools and features that provide customers with a robust and well-rounded monitoring solution.
“We now have over ten times the amount of metrics we started with, and on different accounts. One of the great things about MetricFire is that scaling to support this increase has been hassle-free, requiring no additional work on our side.”
“Building and managing an on-premise installation at this scale would require a lot of engineer time, especially in the first year...we use this engineering time to work on initiatives closer to our core business”
“There’s complete transparency with everything MetricFire do which means we can accurately predict what we’ll be spending and comfortably keep within our budget.”
"Every time I have a question, I get an answer from support after just a couple of hours. Their technical knowledge is excellent.”
By grouping Graphite metrics using wildcard queries, alerts can be defined around meaningful dimensions... Continue Reading
PrometheusのメトリクスをGraphiteのメトリクスとして監視することで、メトリクスの整理が簡素化され、管理や理解が容易な、明快で階層的な命名構造が実現されます。Graphiteのシンプルなクエリ構文と長期的なデータ保持への重点は、過去の傾向分析が重要な環境において理想的であり、Prometheusのラベルベースのシステムにしばしば伴う複雑さを軽減します。メトリクスをGraphiteに統合することで、操作や保守が容易な、よりユーザーフレンドリーで一貫性のある監視環境を構築できます。 Continue Reading