 +
+

To integrate HAProxy with MetricFire, please sign up for a free 14 day trial. We want to fully understand your requirements and monitoring goals, so we can advise you on how to obtain better visibility into your infrastructure. Please book a demo with us so we can show you how quick and easy it is to get meaningful data into your MetricFire account, and use that data to build custom dashboards and alerts.
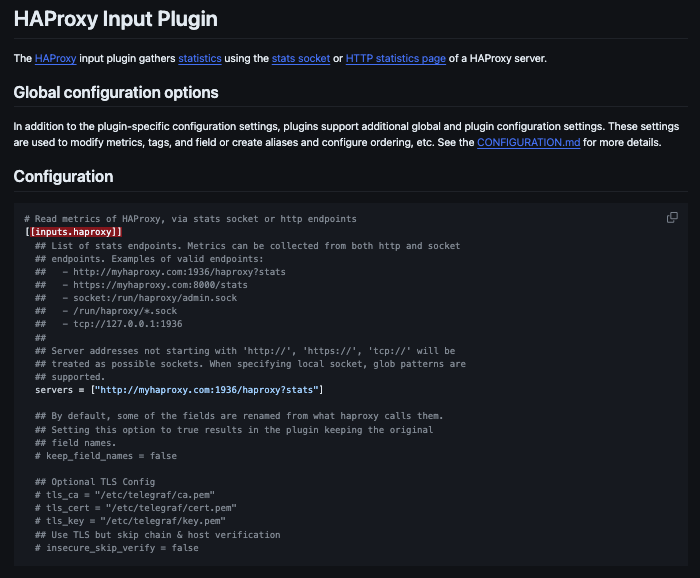
Telegraf is a plugin-driven server agent built on InfluxDB, and can be used for collecting and sending statistics from servers, databases, processes, devices, and a range of 3rd party technology platforms. It is compatible with most operating systems, and has many useful output plugins and input plugins for tracking a wide variety of performance metrics.
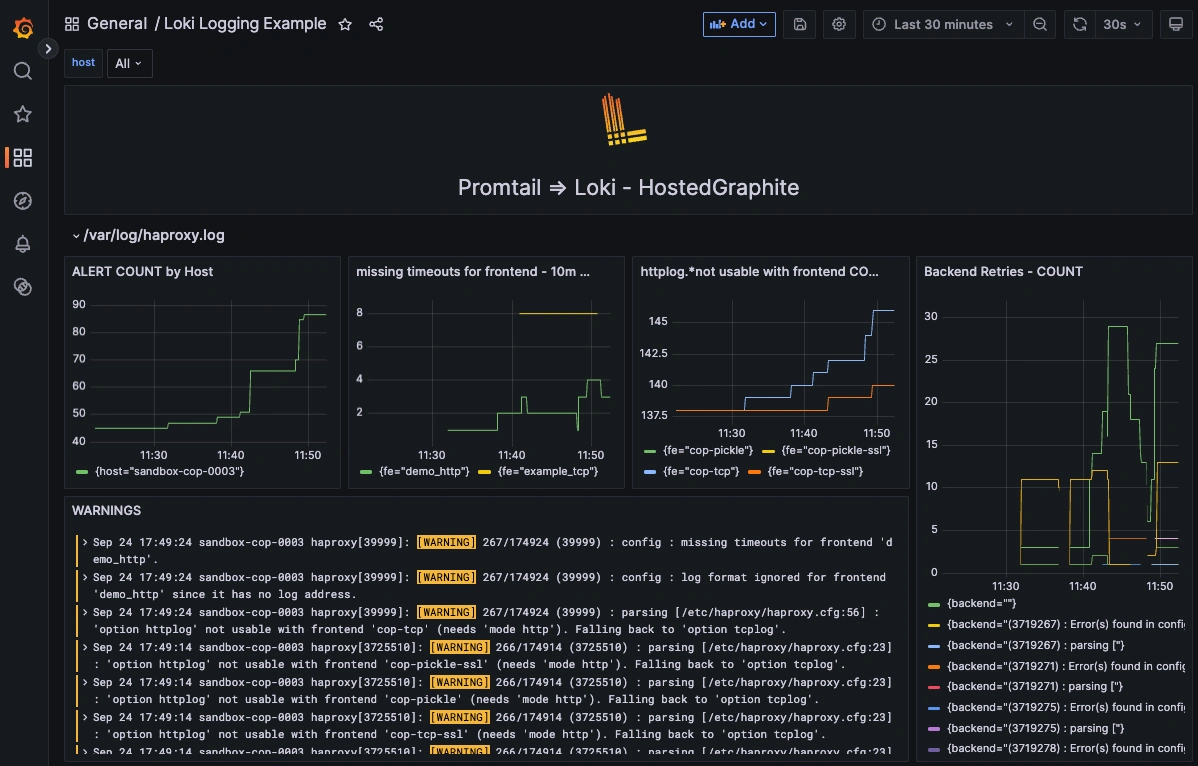
Hosted Loki is our logging endpoint that receives logs via the Promtail collector agent. Pairing logs with metrics on your Hosted Grafana dashboards gives you full insight into your systems and running services.
Follow these steps to get started:
MetricFire is a full-scale platform that provides infrastructure, system, and application monitoring using a suite of open-source tools. We will aggregate and store your data as time series metrics, which can be used to build custom dashboards and alerts. MetricFire takes away the burden of self-hosting your own monitoring solution, allowing you more time and freedom to work on your most important tasks.
MetricFire offers a complete ecosystem of end-to-end infrastructure monitoring, comprised of open-source Graphite and Grafana. MetricFire handles the aggregation, storage, and backups of your data, and offers alerting, team features, and API's for easy management of your monitoring environment. You can send server metrics using one of our agents, custom metrics from within your application code, and integration metrics from a variety of popular 3rd party services that we integrate with like Heroku, AWS, Azure, GCP, and many more!
Our Hosted Graphite product has improved upon standard Graphite to add data dimensionality, optimized storage, and offers additional tools and features that provide customers with a robust and well-rounded monitoring solution.
“We now have over ten times the amount of metrics we started with, and on different accounts. One of the great things about MetricFire is that scaling to support this increase has been hassle-free, requiring no additional work on our side.”
“Building and managing an on-premise installation at this scale would require a lot of engineer time, especially in the first year...we use this engineering time to work on initiatives closer to our core business”
“There’s complete transparency with everything MetricFire do which means we can accurately predict what we’ll be spending and comfortably keep within our budget.”
"Every time I have a question, I get an answer from support after just a couple of hours. Their technical knowledge is excellent.”
サービスレベルのアラート機能は、関連するシグナルを1つのシステムビューに集約することで、不要なアラートを削減します。複合アラート機能は、その基盤の上に、各シグナルの相互作用を定義することで、個別のメトリクスの変化ではなく、システム全体の意味のある動作を反映したアラートを実現します。 Continue Reading
本記事では、Graphiteワイルドカードを活用してアラートノイズを削減する方法を解説。サービスレベルでメトリクスをグループ化し、Hosted GraphiteやGrafanaで効率的かつスケーラブルな監視・アラート設計を実現するベストプラクティスをご紹介します。 Continue Reading